figures that start in background tabs are cut off at bottom
Nessuno ha ancora preso questa issue.
Valutazione
- Difficoltà
- 3/5
- Tempo stimato
- 1-2 giorni
- Idoneità per principianti
- 45/100
- Tipo di issue
- Bug
- Chiarezza
- Abbastanza chiara
- Stato di attività
- Ferma
- Stack tecnologico
- jupyter, jupyter-notebook, python
- Ambito
- data-visualization, frontend
Direzione di ricerca
Inizia eseguendo l'esempio minimo di notebook con due schede ipywidgets e figure matplotlib, quindi confronta le dimensioni della seconda figura, inizialmente nascosta, con quelle della prima. Traccia il modo in cui vengono stabilite le dimensioni della figura quando la seconda scheda diventa visibile. Il lavoro è completato quando le figure in ogni scheda mostrano l'intera area del grafico senza essere tagliate.
Scritto dal modello di indicizzazione a partire dal testo della issue.
Descrizione
I'm having some trouble with figures getting cut off at the bottom when they're included in tabs other than the first tab. Here's a minimal example. Note that I put the figures in boxes because I have the same problem as #126 if I don't.
%matplotlib widget
import matplotlib.pyplot as plt
plt.ioff()
import ipywidgets as widgets
import numpy as np
fig1,ax1 = plt.subplots()
ax1.scatter(np.arange(10),np.random.random(10))
ax1.set_xlabel('x axis')
ax1.set_ylabel('y axis')
fig2,ax2 = plt.subplots()
ax2.plot(np.arange(10),np.random.random(10))
ax2.set_xlabel('x axis')
ax2.set_ylabel('y axis')
tabs = widgets.Tab(children=[widgets.Box([fig1.canvas]),widgets.Box([fig2.canvas])])
tabs.set_title(0, 'fig1')
tabs.set_title(1, 'fig2')
tabs
The first tab looks like (I clicked on the figure to show the boundaries)

and the second tab looks like:
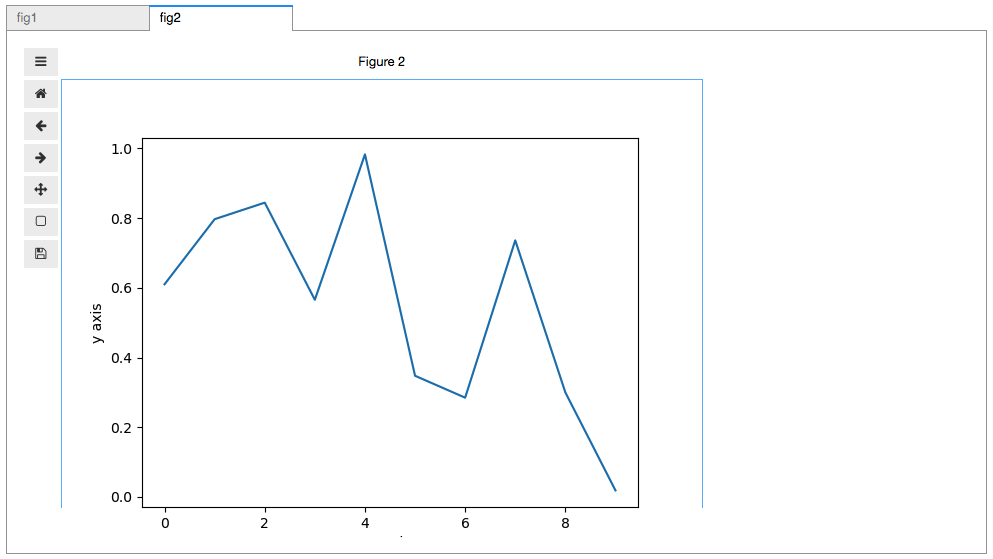
I just cannot figure out why the bottom of that second figure is getting cut off.
- Lingua principale
- Jupyter Notebook
- Stelle
- 1.7k
- Fork
- 234
- Metriche di merge delle PR
- Nessuna PR unita negli ultimi 30g
Guida per i contributori
Apri la guida per i contributori
Come iniziare
- Leggi tutta la issue e poi la guida ai contributi del progetto.
- Commenta sulla issue per dire che te ne occupi tu — evita che due persone facciano lo stesso lavoro.
- Fai un fork del repository e lavora su un branch.
- Apri una pull request che faccia riferimento al numero della issue.
Altre issue di matplotlib/ipympl
-
Difficoltà 4/5 3-5 giorni Idoneità per principianti 35/100
matplotlib/ipympl#623 · 1 commento ·
-
Difficoltà 4/5 3-5 giorni Idoneità per principianti 35/100
matplotlib/ipympl#622 · 13 commenti ·
-
Difficoltà 4/5 3-5 giorni Idoneità per principianti 42/100
matplotlib/ipympl#612 ·
-
Difficoltà 3/5 1-2 giorni Idoneità per principianti 45/100
matplotlib/ipympl#611 · 4 commenti ·
-
Difficoltà 4/5 3-5 giorni Idoneità per principianti 42/100
matplotlib/ipympl#609 · 7 commenti ·
Tutte le issue di matplotlib/ipympl
Issue simili
-
Difficoltà 2/5 1-3 ore Idoneità per principianti 75/100
pydata/pydata-sphinx-theme#2503 ·
-
bug triage_needed
Difficoltà 2/5 1-3 ore Idoneità per principianti 75/100
-
P3 size: 1 task
Difficoltà 2/5 1-3 ore Idoneità per principianti 65/100
-
Difficoltà 2/5 1-3 ore Idoneità per principianti 82/100
-
🦾 ai-candidate
Difficoltà 2/5 1-3 ore Idoneità per principianti 88/100