Lineplot's geometric mean throwing 500s with y-axis date vars
Nessuno ha ancora preso questa issue.
Valutazione
- Difficoltà
- 3/5
- Tempo stimato
- 1-2 giorni
- Idoneità per principianti
- 42/100
- Tipo di issue
- Bug
- Chiarezza
- Abbastanza chiara
- Stato di attività
- Ferma
- Stack tecnologico
- r
- Ambito
- data-visualization
Direzione di ricerca
Start by reproducing the lineplot geometric mean request with a Date-valued y-axis using the Amazonia ICEMR Brazil Cohort, then follow the Rserve error where Math.Date receives a Date object. Compare it with the successful geometric mean response; done means the Date-axis request no longer returns a 500.
Scritto dal modello di indicizzazione a partire dal testo della issue.
Descrizione
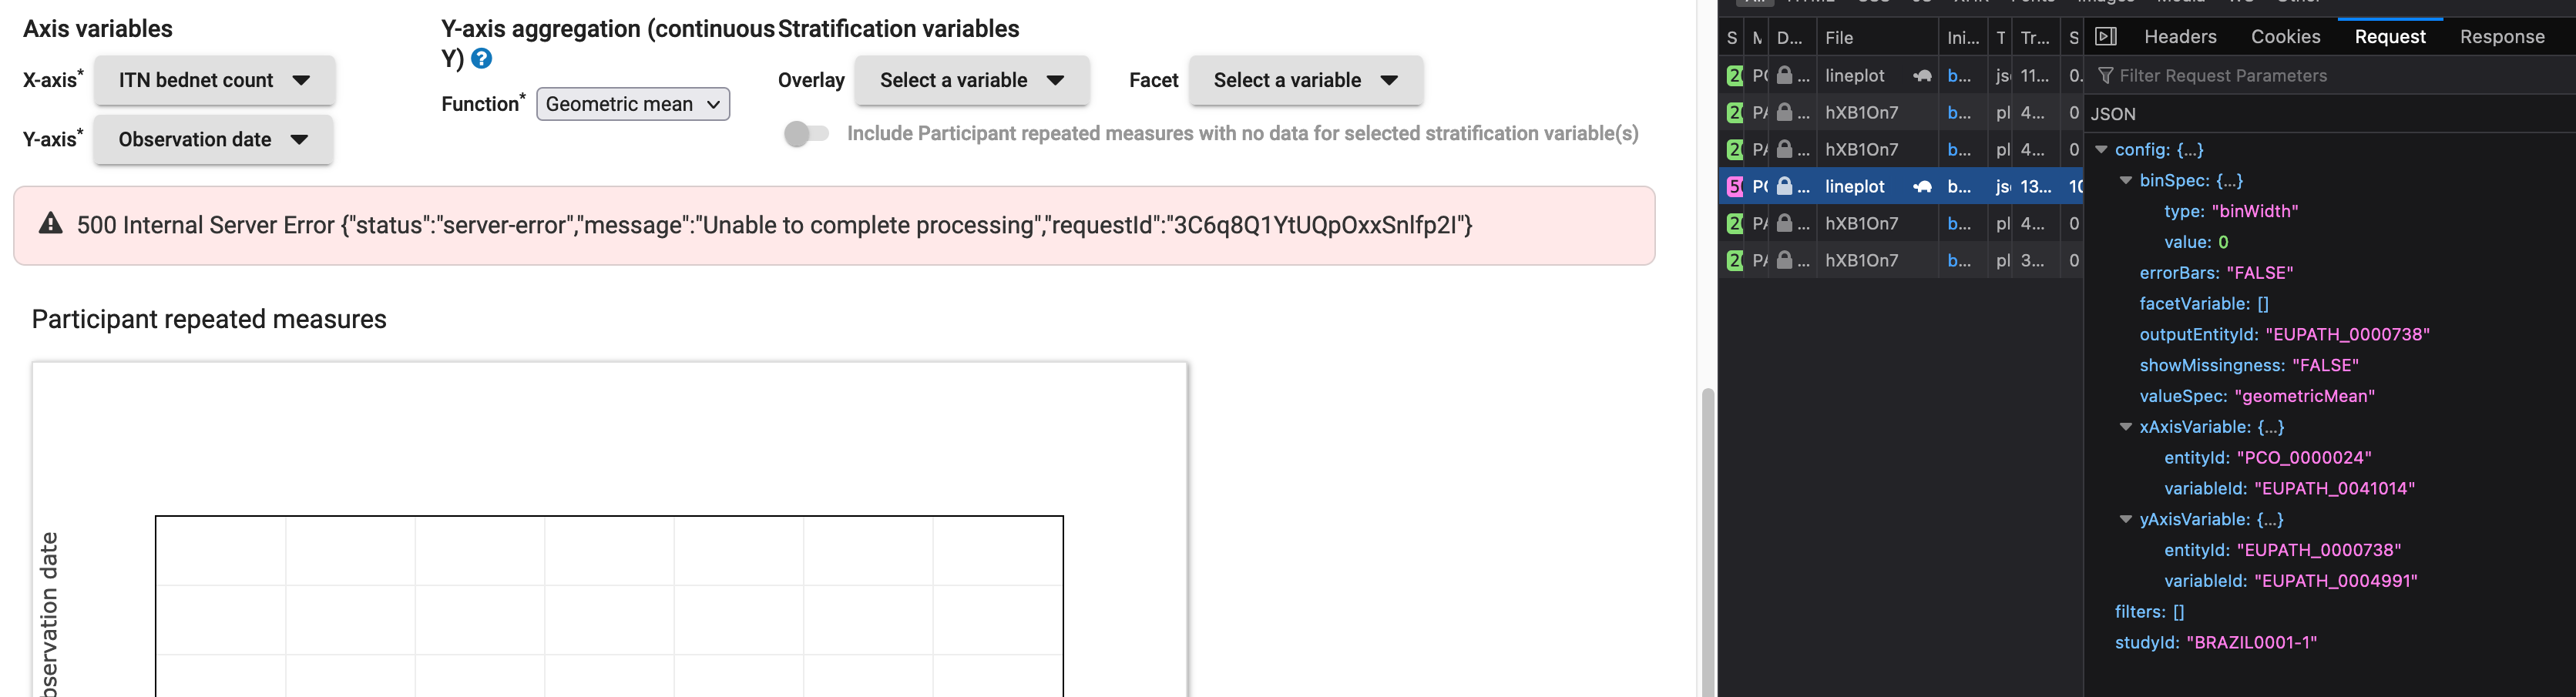
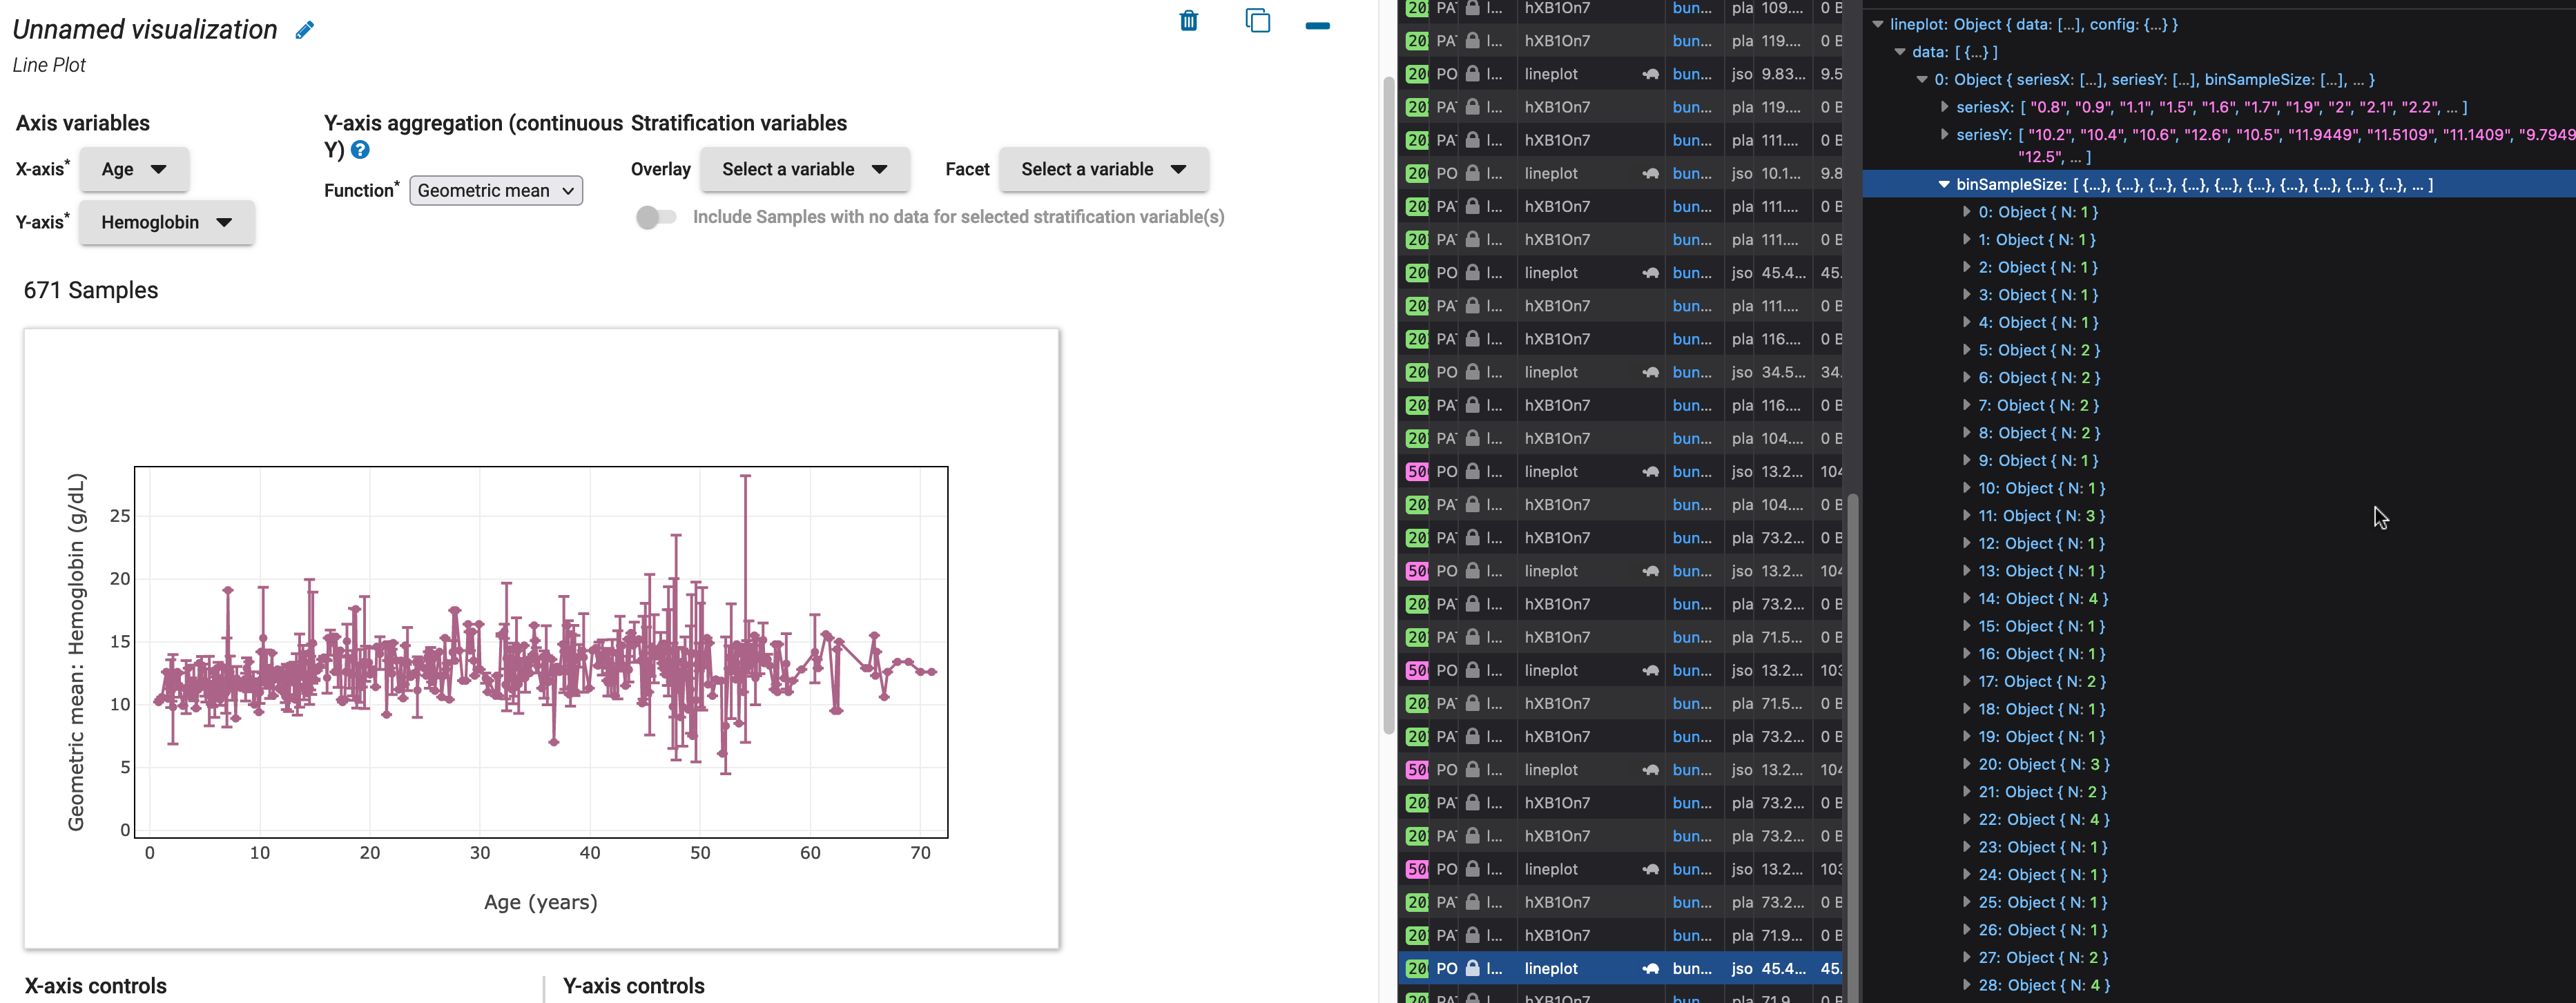
In implementing the new lineplot UI to include Geometric Mean, I encounter a 500 error when the y-axis variable is a Date object. I've included a screenshot showing the request and lineplot config using Amazonia ICEMR Brazil Cohort and the subsequent error log. At the end, I've included a successful response for a lineplot geometric mean request.
Screenshot of Error Config
Error Log
==> /var/log/containers/docker.eda_dev_rserve_1.log <==
Rserve started in non-daemon mode.

2022-08-23 21:01:34 Map has been validated.

2022-08-23 21:01:34 Encountered empty or NULL naToZero value. Setting naToZero = FALSE.

2022-08-23 21:01:34 Encountered empty or NULL naToZero value. Setting naToZero = FALSE.

2022-08-23 21:01:34 Determined the number of complete cases per variable.

2022-08-23 21:01:34 Identified facet intersections.

2022-08-23 21:01:34 Base data types updated for all columns as necessary.

2022-08-23 21:01:34 Determined total number of complete cases across axes and strata vars.

2022-08-23 21:01:34 Calculated sample sizes per group.

2022-08-23 21:01:34 Base plot.data object created.

2022-08-23 21:01:34 Determined default viewport.

2022-08-23 21:01:34 Determined bin width slider min, max and step values.
Error in Math.Date(x[x > 0]) : log not defined for "Date" objects

==> /var/log/containers/docker.eda_dev_user_1.log <==
Screenshot of Successful Response
- Lingua principale
- R
- Stelle
- 1
- Fork
- 0
- Metriche di merge delle PR
- Nessuna PR unita negli ultimi 30g
Guida per i contributori
Nessuna guida per i contributori indicizzata per questo repository
Come iniziare
- Leggi tutta la issue e poi la guida ai contributi del progetto.
- Commenta sulla issue per dire che te ne occupi tu — evita che due persone facciano lo stesso lavoro.
- Fai un fork del repository e lavora su un branch.
- Apri una pull request che faccia riferimento al numero della issue.
Altre issue di VEuPathDB/plot.data
-
Difficoltà 2/5 1-3 ore Idoneità per principianti 25/100
-
Difficoltà 3/5 1-2 giorni Idoneità per principianti 35/100
-
Difficoltà 3/5 1-2 giorni Idoneità per principianti 35/100
-
Difficoltà 5/5 Più di una settimana Idoneità per principianti 25/100
-
empty two by two Aperta
Difficoltà 4/5 3-5 giorni Idoneità per principianti 35/100
Tutte le issue di VEuPathDB/plot.data
Issue simili
-
Difficoltà 2/5 1-3 ore Idoneità per principianti 72/100
pharmaverse/rtables#1123 · 1 commento ·
-
Difficoltà 2/5 1-3 ore Idoneità per principianti 72/100
-
Trying to reassign a reactiveVal to the name of an existing reactiveVal doesn't overwrite the latter Aperta
Difficoltà 2/5 1-3 ore Idoneità per principianti 78/100
-
Difficoltà 1/5 Meno di un'ora Idoneità per principianti 90/100
RConsortium/rconsortium_website#649 · 2 commenti ·
-
Difficoltà 2/5 1-3 ore Idoneità per principianti 74/100
posit-dev/r-shinylive#203 ·