Bug report: Incorrect drawing order of Isosurfaces with opacity
維護者通常 1 天內回覆
還沒有人認領這個 Issue。
評估
- 難度
- 4/5
- 預估耗時
- 3-5 天
- 新手友好度
- 38/100
- Issue 類型
- 缺陷
- 描述清晰度
- 基本清楚
- 活躍度
- 停滯
- 技術堆疊
- python
研究方向
首先在 Chrome 中執行提供的 Python 重現程式,並比較不透明度為 0.99 與 1 時的 isosurface 和 volume rendering。調查不透明與近乎不透明的 Isosurfaces、multisurfaces 及 volume plots 的渲染路徑。當提供的案例依正確順序繪製,且不會導致完全不透明渲染發生回歸時,即視為完成。
由索引模型根據 Issue 內容生成。
描述
- Reported by Łukasz as a post on the forum
- Plotly version: 6.2.0
- Python version: 3.11.13
- Browser: chrome
Hi, i have found quite annoying bug which can be seen only when the isosurface components are opaque. I observed that it doesn’t only occur for multiple trace isosurfaces, but also single multisurface isosurfaces and volume plots.
Here is an example code how to replicate it:
(The fun part is that when you change the opacity from 0.99 to 1 the plot gets visualised properly.)
import plotly.graph_objects as go
import numpy as np
import nrrd
from skimage.transform import resize


volume = np.zeros((50, 50, 50))
volume[1:10, 5:45, 5:45] =1
volume[10:20, 5:45, 5:45] = 1.5
volume[20:30, 5:45, 5:45] = 2
volume[30:40, 5:45, 5:45] = 2.5
volume[40:49, 5:45, 5:45] = 3
Z, X, Y = np.mgrid[0:volume.shape[0]:1, 0:volume.shape[1]:1, 0:volume.shape[2]:1]


fig = go.Figure(data=[go.Isosurface(
    x=X.flatten(),
    y=Y.flatten(),
    z=Z.flatten(),
    opacity=0.99,
    value=np.where(volume == 1, 1, 0).flatten(),
    surface_fill=1,
    surface_count=1,
    colorscale=[[0, 'rgb(0,255,0)'], [1, 'rgb(0,255,0)']],
    caps=dict(x_show=False, y_show=False, z_show=False),
    #slices_z=dict(show=True, locations=list(range(volume.shape[0]))),
    ),
    go.Isosurface(
        x=X.flatten(),
        y=Y.flatten(),
        z=Z.flatten(),
        opacity=0.99,
        value=np.where(volume == 3, 1, 0).flatten(),
        surface_fill=1,
        surface_count=1,
        colorscale=[[0, 'rgb(255,0,0)'], [1, 'rgb(255,0,0)']],
        caps=dict(x_show=False, y_show=False, z_show=False),
        # slices_z=dict(show=True, locations=list(range(volume.shape[0]))),
    )])
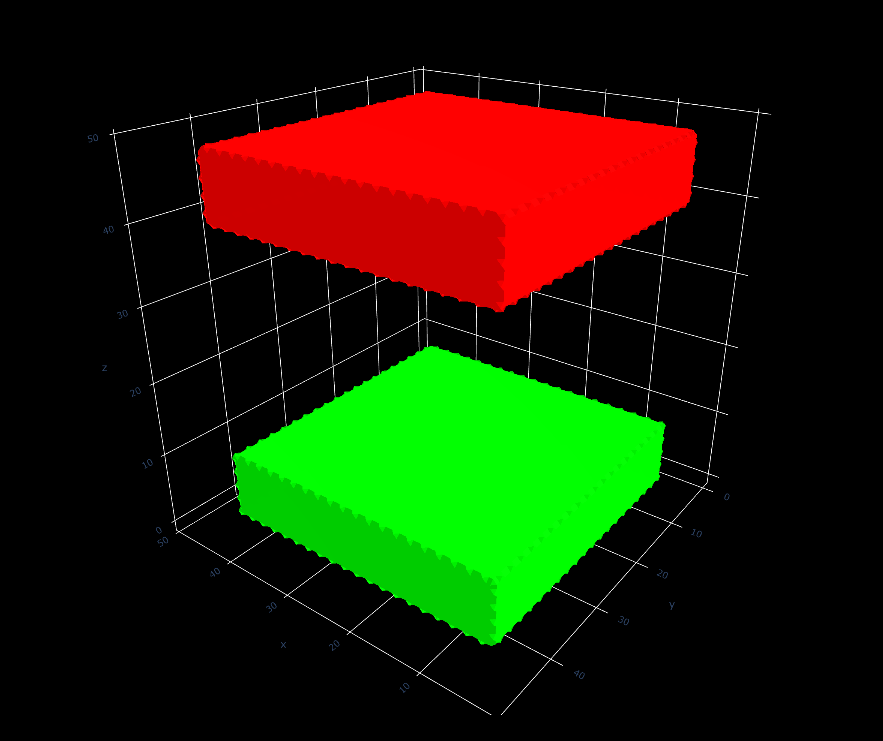
The bug can be seen looking form under the plot:

- 主要語言
- Python
- 星號
- 18.8k
- 分支
- 2.8k
- 平均合併
- 14 小時 12 分鐘
- 30 天內合併 PR
- 19
環境準備
從這裡開始
- 先讀完整個 Issue,再讀專案的貢獻指南。
- 在 Issue 下留言說明你要接手 —— 這能避免兩個人做同樣的事。
- Fork 儲存庫,在一個分支上完成修改。
- 送出 Pull Request,並在描述裡引用這個 Issue 編號。
plotly/plotly.py 的其他 Issue
-
P3 size: 1 task
難度 2/5 1-3 小時 新手友好度 65/100
plotly/plotly.py#5769 · 1 個 reaction ·
維護者通常 1 天內回覆
-
P3 size: 1 task
難度 2/5 1-3 小時 新手友好度 72/100
維護者通常 1 天內回覆
-
bug P1
難度 1/5 1 小時以內 新手友好度 68/100
維護者通常 1 天內回覆
-
feature P3
難度 2/5 1-3 小時 新手友好度 62/100
維護者通常 1 天內回覆
-
feature P3
難度 2/5 1-3 小時 新手友好度 72/100
plotly/plotly.py#3859 · 1 則留言 ·
維護者通常 1 天內回覆
相似的 Issue
-
[Bug] @deck.gl/arcgis dist import resolves to unpublished @deck.gl/core source path (9.3.11, 9.4.0)未關閉
難度 2/5 1-3 小時 新手友好度 72/100
維護者通常 1 天內回覆
-
workflow: a tick's dispatch counts as 'only this step', and no review self-grants a round unattended未關閉workflow
難度 2/5 1-3 小時 新手友好度 85/100
kristofdegrave/homeassistant-smart-charging#1505 ·
維護者通常 1 天內回覆
-
metadata submission
難度 2/5 1-3 小時 新手友好度 82/100
-
bug
難度 2/5 1-3 小時 新手友好度 65/100
canonical/content-cache-operator#163 · 1 則留言 ·
維護者通常 1 天內回覆
-
[submission]未關閉submission
難度 1/5 1 小時以內 新手友好度 65/100
leanprover/lean-eval-submissions#1852 ·
維護者通常 1 天內回覆