Issue with 95% CI in line plot tooltips when n=1
Nessuno ha ancora preso questa issue.
Valutazione
- Difficoltà
- 4/5
- Tempo stimato
- 3-5 giorni
- Idoneità per principianti
- 35/100
- Tipo di issue
- Bug
- Chiarezza
- Da chiarire
- Stato di attività
- Ferma
- Stack tecnologico
- r
- Ambito
- data-visualization
Direzione di ricerca
Start by reproducing the line plot tooltip behavior with n=1 using both proportion and mean y-axis aggregation, as shown in the issue screenshots. Compare the displayed 95% confidence intervals in each case and determine the expected result before locating the relevant plotting code and adding a regression test.
Scritto dal modello di indicizzazione a partire dal testo della issue.
Descrizione
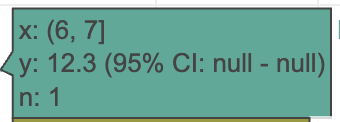
I'm not sure what is going on with the 95% CI when n=1 for the line plot tool tips
sometimes it looks like this (maybe because the y-axis aggregation is in proportion mode?):
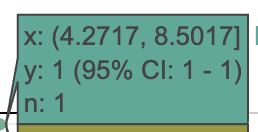
and sometimes it looks like this (maybe because the y-axis aggregation is in mean mode?):
- Lingua principale
- R
- Stelle
- 1
- Fork
- 0
- Metriche di merge delle PR
- Nessuna PR unita negli ultimi 30g
Guida per i contributori
Nessuna guida per i contributori indicizzata per questo repository
Come iniziare
- Leggi tutta la issue e poi la guida ai contributi del progetto.
- Commenta sulla issue per dire che te ne occupi tu — evita che due persone facciano lo stesso lavoro.
- Fai un fork del repository e lavora su un branch.
- Apri una pull request che faccia riferimento al numero della issue.
Altre issue di VEuPathDB/plot.data
-
Difficoltà 2/5 1-3 ore Idoneità per principianti 25/100
-
Difficoltà 3/5 1-2 giorni Idoneità per principianti 35/100
-
Difficoltà 3/5 1-2 giorni Idoneità per principianti 35/100
-
Difficoltà 5/5 Più di una settimana Idoneità per principianti 25/100
-
empty two by two Aperta
Difficoltà 4/5 3-5 giorni Idoneità per principianti 35/100
Tutte le issue di VEuPathDB/plot.data
Issue simili
-
Difficoltà 2/5 1-3 ore Idoneità per principianti 72/100
pharmaverse/rtables#1123 · 1 commento ·
-
Difficoltà 2/5 1-3 ore Idoneità per principianti 72/100
-
Trying to reassign a reactiveVal to the name of an existing reactiveVal doesn't overwrite the latter Aperta
Difficoltà 2/5 1-3 ore Idoneità per principianti 78/100
-
Difficoltà 1/5 Meno di un'ora Idoneità per principianti 90/100
RConsortium/rconsortium_website#649 · 2 commenti ·
-
Difficoltà 2/5 1-3 ore Idoneità per principianti 74/100
posit-dev/r-shinylive#203 ·