Issue with 95% CI in line plot tooltips when n=1
まだ誰も着手していません。
評価
- 難易度
- 4/5
- 見積もり時間
- 3〜5日
- 初心者へのやさしさ
- 35/100
- issue の種類
- バグ
- 明瞭さ
- 説明が足りない
- 活発さ
- 停滞
- 技術スタック
- r
調査の方向性
Start by reproducing the line plot tooltip behavior with n=1 using both proportion and mean y-axis aggregation, as shown in the issue screenshots. Compare the displayed 95% confidence intervals in each case and determine the expected result before locating the relevant plotting code and adding a regression test.
索引モデルが issue の本文から書いたものです。
説明
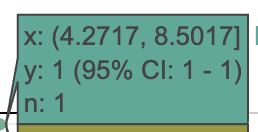
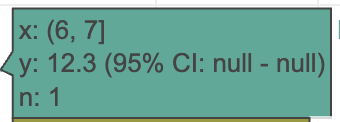
I'm not sure what is going on with the 95% CI when n=1 for the line plot tool tips
sometimes it looks like this (maybe because the y-axis aggregation is in proportion mode?):
and sometimes it looks like this (maybe because the y-axis aggregation is in mean mode?):
- 主要言語
- R
- スター
- 1
- フォーク
- 0
- PR マージ指標
- 30日以内にマージされた PR はありません
コントリビューションガイド
このリポジトリのコントリビューションガイドは索引されていません
はじめの一歩
- issue を最後まで読み、次にプロジェクトのコントリビューションガイドを読みます。
- 着手することを issue にコメントします — 二人が同じ作業をするのを防げます。
- リポジトリをフォークし、ブランチを切って変更します。
- issue 番号を参照したプルリクエストを送ります。
VEuPathDB/plot.data のほかの issue
-
難易度 2/5 1〜3時間 初心者へのやさしさ 25/100
-
難易度 3/5 1〜2日 初心者へのやさしさ 35/100
-
難易度 3/5 1〜2日 初心者へのやさしさ 35/100
-
難易度 5/5 1週間以上 初心者へのやさしさ 25/100
-
empty two by two オープン
難易度 4/5 3〜5日 初心者へのやさしさ 35/100
VEuPathDB/plot.data の issue をすべて見る
似ている issue
-
bug triage_needed
難易度 2/5 1〜3時間 初心者へのやさしさ 75/100
-
難易度 2/5 1〜3時間 初心者へのやさしさ 72/100
pharmaverse/rtables#1123 · コメント 1 件 ·
-
難易度 2/5 1〜3時間 初心者へのやさしさ 72/100
-
難易度 1/5 1時間未満 初心者へのやさしさ 85/100
-
Trying to reassign a reactiveVal to the name of an existing reactiveVal doesn't overwrite the latter オープン
難易度 2/5 1〜3時間 初心者へのやさしさ 78/100