Instruction breakpoints: lifetime of memory references and persistence
@roblourens がすでに取り組んでいます。
2022年10月10日 から。
評価
この issue はまだ評価されていません。
説明
I'm looking into implementing instruction breakpoints, having wrestled with disassembly recently, and I'm a bit perplexed about how to use the API, for similar reasons.
Here's how the user might see things:
- I'm presented with a disassembly view, in which I can step by instruction, step into by instruction, etc.
- I would like to add a breakpoint at a specific instruction, just like I would add a line breakpoint in the source code.
- Just like line/function/exception breakpoints I expect that I can continue to step around and run the program, and the breakpoint persists (at least while the debugee is running and the debugger attached).
- Just like line/function/exception breakpoints, I expect the UI to render an indicator next to the instruction where the breakpoint is located (e.g. a red blob or arrow)
To give some context to what follows, here's what the Vimspector UI looks like showing disassembly alongside code:
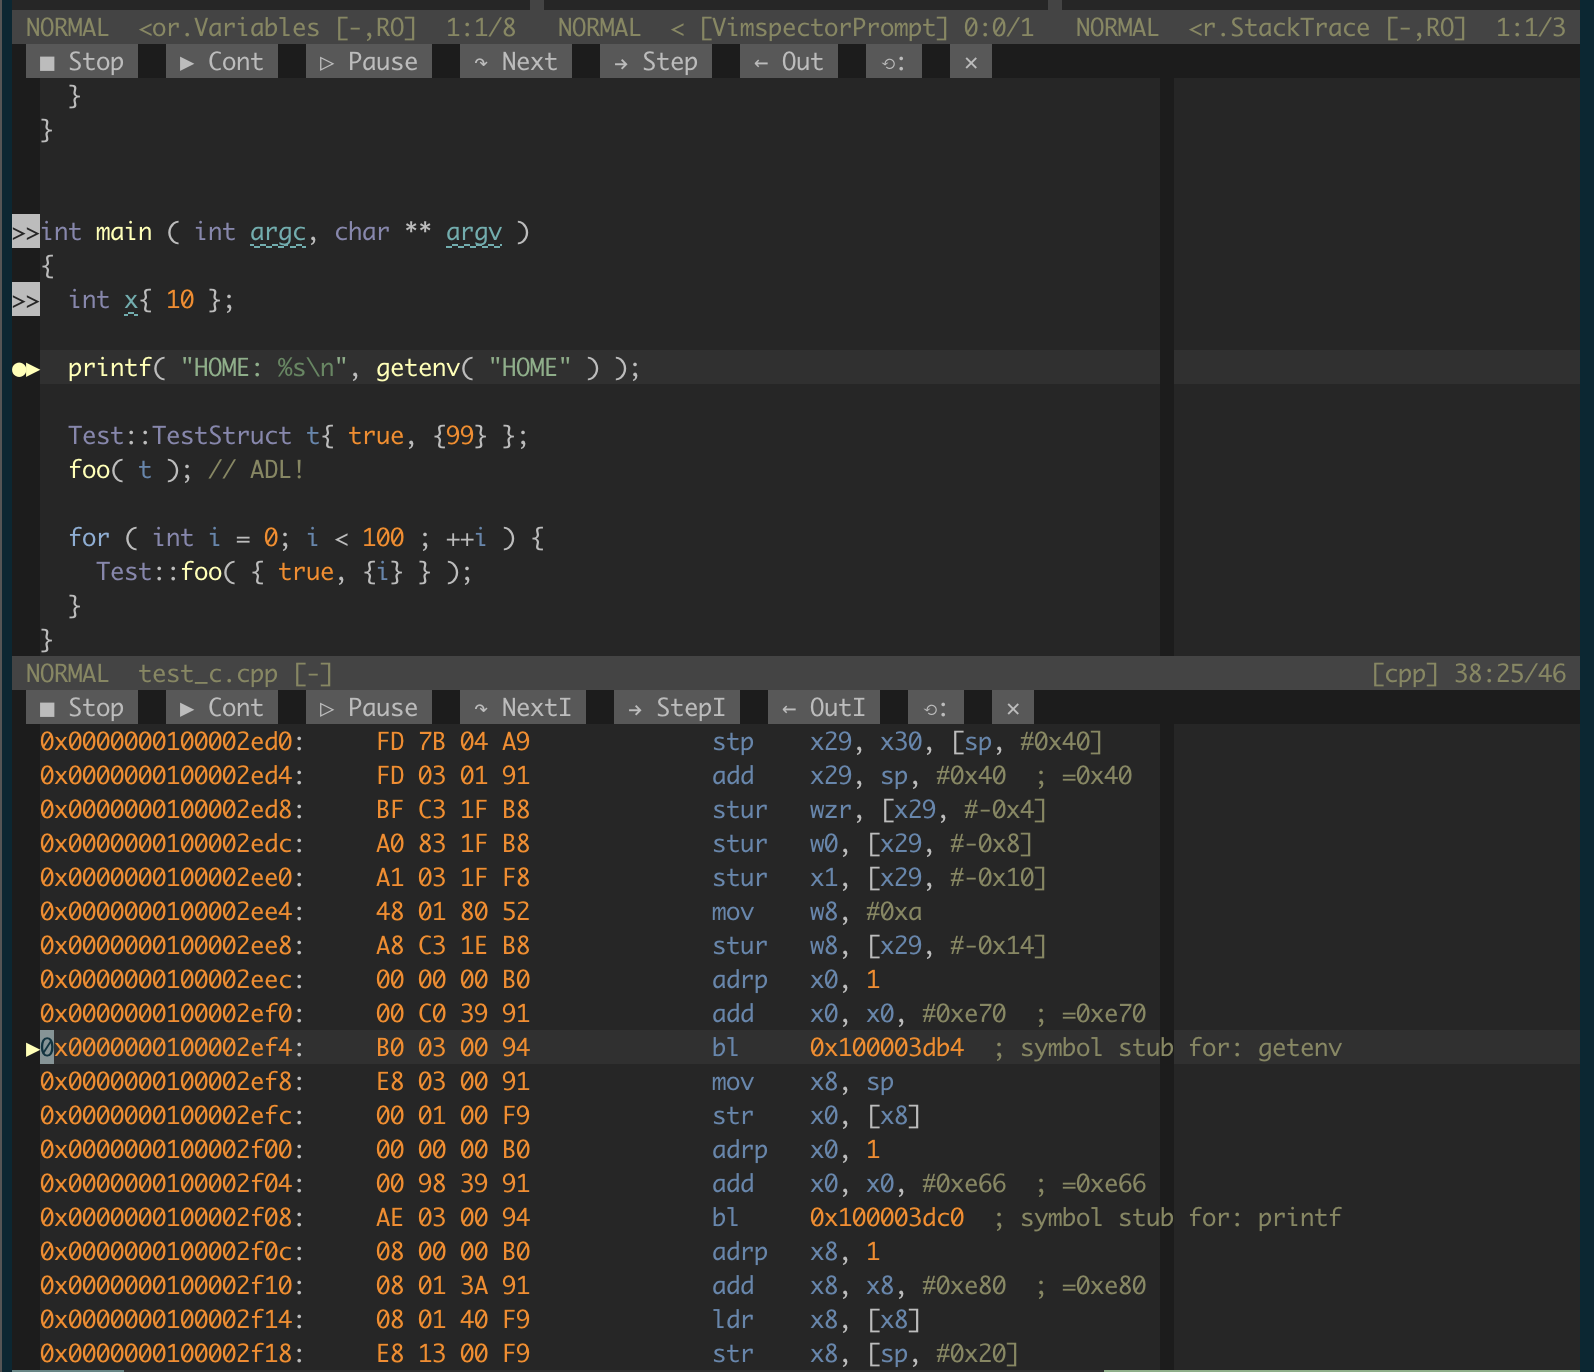
You can see the PC is represented in the "code" and "disassembly" windows by a little yellow arrow. You can ignore the other window dressing noise for now.
So what the client is doing here is disassembling around the instructionPointerReference provided in the StackFrame (as mentioned in the linked issue). What I would like is for the user to be able to select a line in the disassembly view and set a breakpoint there. To do this I need to:
- Take the
instructionPointerReferencethat was used to generate the disassembly displayed - Determine the offset of the selected instruction from the instruction representing the
instructionPointerReference - Send a
setInstructionBreakpointsrequest withinstructionReferenceandoffsetset as above. - Draw a 'marker' on the line of the disassembly where the breakpoint was requested (assumption for simplicity: the returned breakpoint is valid and does not move).
That all seems perfectly reasonable and straightforward. However, the problem comes with what to do the next time a stopped event is triggered, such as after a next command. At that point, I want to update the disassembly view with the new instructionPointerReference, so that I can show the "new" instruction pointer position in the disassembly (e.g. in case of stepping into a call instruction), so I issue a new disassemble request around that new reference. OK so far.
Now my task is to render a 'marker' for the instruction breakpoint that was added above (the previous under the previous 'stopped' event). As far as I know the previous references are all void at this point, and I cannot make any assumption about the contents of the new instructionPointerReference compared with the old one.
Here's the total data (afaik) that I could have stored about the breakpoint:
- The memory reference used for the request (now invalid)
- The offset from that reference
- The address of the instruction
- The (memory reference + offset) returned for the breakpoint
- The instruction bytes (?!)
- The line number that the instruction was on at the time the breakpoint was created (?!)
So, given all of the above, the question is: How can I persistently indicate the location of an instruction breakpoint across disassembly requests, or at least across continue/stopped events while maintaining the ability to display the instruction coinciding with the current PC?
I hope that was clear - sorry for the wall of text.
- 主要言語
- HTML
- スター
- 1.8k
- フォーク
- 173
- 平均マージ
- 7日 7時間
- マージ済み PR(30日)
- 2
環境構築
はじめの一歩
- issue を最後まで読み、次にプロジェクトのコントリビューションガイドを読みます。
- 着手することを issue にコメントします — 二人が同じ作業をするのを防げます。
- リポジトリをフォークし、ブランチを切って変更します。
- issue 番号を参照したプルリクエストを送ります。
microsoft/debug-adapter-protocol のほかの issue
-
難易度 2/5 1〜3時間 初心者へのやさしさ 68/100
-
難易度 5/5 1週間以上 初心者へのやさしさ 35/100
microsoft/debug-adapter-protocol#633 · コメント 1 件 ·
-
難易度 4/5 3〜5日 初心者へのやさしさ 42/100
-
難易度 5/5 1週間以上 初心者へのやさしさ 35/100
microsoft/debug-adapter-protocol#599 · リアクション 8 件 ·
-
under-discussion
難易度 2/5 1〜3時間 初心者へのやさしさ 48/100
microsoft/debug-adapter-protocol#596 · コメント 9 件 ·