streamparticles() not working correctly
還沒有人認領這個 Issue。
評估
- 難度
- 3/5
- 預估耗時
- 1-2 天
- 新手友好度
- 35/100
- Issue 類型
- 缺陷
- 描述清晰度
- 基本清楚
- 活躍度
- 停滯
- 技術堆疊
- matlab
研究方向
使用提供的 wind、streamslice()、interpstreamspeed()、streamparticles() 和 fig2plotly() 範例重現問題,然後將產生的圖表與預期影像以及 MathWorks 的 streamparticles() 範例進行比較。當轉換後的繪圖保留串流粒子視覺化效果,而不是將其呈現為 3-D 散佈圖時,即表示完成。
由索引模型根據 Issue 內容生成。
描述
When using streamparticles() to draw stream particles of a vector field, the particles are plotted as a 3-D scatter chart.
load wind
[verts,averts] = streamslice(x,y,z,u,v,w,[],[],5);
iverts = interpstreamspeed(x,y,z,u,v,w,verts,.05);
streamparticles(iverts, 200)

fig2plotly(gcf, 'offline', false);
Expected and generated (https://chart-studio.plotly.com/~xarico10/1009/#/) plots:
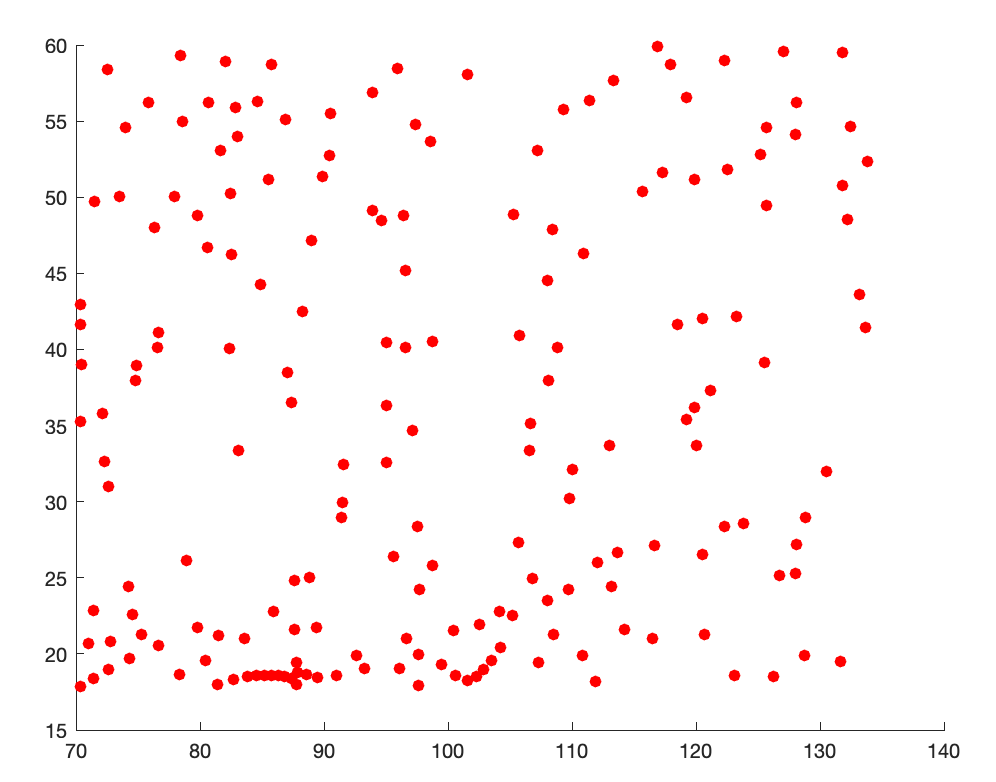

Examples on using streamparticles() can be found on:
https://www.mathworks.com/help/matlab/ref/streamparticles.html
- 主要語言
- MATLAB
- 星號
- 414
- 分支
- 166
- PR 合併指標
- 30 天內沒有已合併 PR
環境準備
- 沒有 Dockerfile 或 Docker Compose 檔案
- 沒有 Pull Request 範本
- 閱讀貢獻指南
從這裡開始
- 先讀完整個 Issue,再讀專案的貢獻指南。
- 在 Issue 下留言說明你要接手 —— 這能避免兩個人做同樣的事。
- Fork 儲存庫,在一個分支上完成修改。
- 送出 Pull Request,並在描述裡引用這個 Issue 編號。
plotly/plotly_matlab 的其他 Issue
-
難度 3/5 1-2 天 新手友好度 45/100
plotly/plotly_matlab#523 · 1 則留言 ·
-
難度 4/5 3-5 天 新手友好度 35/100
plotly/plotly_matlab#481 · 1 則留言 ·
-
難度 3/5 1-2 天 新手友好度 35/100
plotly/plotly_matlab#480 ·
-
難度 1/5 1 小時以內 新手友好度 35/100
plotly/plotly_matlab#479 · 1 則留言 · 3 個 reaction ·
-
難度 2/5 1-3 小時 新手友好度 25/100
plotly/plotly_matlab#474 ·
查看 plotly/plotly_matlab 的全部 Issue
相似的 Issue
-
難度 2/5 1-3 小時 新手友好度 85/100
flybywiresim/aircraft#11006 ·
維護者通常 2 天內回覆
-
bug
難度 2/5 1-3 小時 新手友好度 75/100
HenrikBengtsson/R.matlab#61 ·
-
easy first-contributor first-contributors good first issue help wanted matlab up-for-grabs
難度 1/5 1 小時以內 新手友好度 85/100
fork-commit-merge/fork-commit-merge#8442 ·
維護者通常 1 天內回覆
-
難度 1/5 1 小時以內 新手友好度 87/100
VH-Lab/NDI-matlab#1115 · 1 則留言 ·
維護者通常 1 天內回覆
-
bug-report SimpleFlight
難度 2/5 1-3 小時 新手友好度 68/100
iamaisim/ProjectAirSim#241 ·
維護者通常 1 天內回覆