Client performance (tracking): crowds, effects and the character pipeline
Maintainer thường phản hồi trong vòng 1 ngày
Chưa có ai nhận issue này.
Đánh giá
- Độ khó
- 5/5
- Thời gian dự kiến
- Hơn một tuần
- Mức phù hợp với người mới
- 5/100
- Loại issue
- Lỗi
- Độ rõ ràng
- Cần làm rõ
- Mức độ hoạt động
- Sôi nổi
- Công nghệ
- typescript
- Lĩnh vực
- game-dev, performance
Hướng nghiên cứu
This is a multi-part performance effort with several pull requests in review or changes requested, so it is not a first task. If you want to help, start with the review threads on the linked pull requests. The budget accounting lives in runtime/renderer/characters/characters.ts (advanceParticles, planBatches) and limits in foundation/animation/character-budget.ts. Done means the linked pull request's benchmark numbers hold.
Do mô hình lập chỉ mục viết ra từ nội dung của issue.
Mô tả
One place for the client's performance work: what was measured, what has merged, what is in review and what comes next. Every change is its own pull request, linked here, and this body is kept current. The original crowd report (2026-11-15) and its analysis are at the bottom, folded.
Where it stands
Measured 2026-11-15 on an idle MacBook Pro M5 Pro, Chrome headless with WebGPU, bench bundles, A-B-B-A order, 6 s windows.
- Before: main just before this series (189ad3e5).
- After: main with every open pull request below merged.
| Scene | Before | After |
|---|---|---|
| 100 monsters, 1600×900, unlocked | 265 fps | 591 fps |
| 100 monsters, main thread at 60 Hz | 6.41 ms | 3.79 ms |
| Qin-Shi tomb B1, 1600×900, unlocked | 644 fps | 986 fps |
| Tomb B1, main thread at 60 Hz | 3.85 ms | 3.08 ms |
| Jangan gate, main thread at 60 Hz | 2.27 ms | 1.98 ms |
| 200 geared players: bodies drawn, of 256 visible | 0 (2 draws in all) | 183; 256 with #3619 |
| 200 geared players, main thread at 60 Hz (1600×900 / 3808×1892) | 7.84 / 7.63 ms | 6.01 / 5.77 ms with 183 bodies drawn; 8.08 ms at 1600×900 with #3619, which draws all 256 and their glows |
fps-bench --at crowd (32 real players), main thread at 60 Hz, still / drag |
2.30 / 2.80 ms | 1.92 / 2.51 ms |
What the numbers say:
- The frame is CPU-bound. In a crowd the main thread sets the frame time: at 3808×1892 the GPU spends about 1.6 ms a frame. What is left on the main thread is broken down under "What a frame costs now".
- No high-resolution regression. With an unlocked frame rate at 3808×1892, frame-time spikes appear whenever a build runs above about 500 fps, main included. They follow the frame rate, not any pull request: each one was measured alone, in mirrored order. At a locked frame rate there are none.
Merged
| Pull request | What it fixed | Measured |
|---|---|---|
| #3552 | The simulation worker resent every moving entity's whole walking path in every world batch. It sends the change. | 696–834 KB → 21–29 KB a batch; decode 102–160 → 4–6 ms/s |
| #3570 | Glows took the render budget before bodies: at 200 players no body drew, not even the local player's. Bodies come first; a glow never draws without its holder. | 200 players: 0 → 95 bodies drawn |
| #3574 | A pose was charged 80 bytes per channel of every clip. It is charged one cursor per clip timeline. | about 357 → 76 KB a body |
| #3575 (@ByEzel93) | Name tags past the UI buffer no longer end the session. | |
| #3576 (@ByEzel93) | A character seen for the first time waits, up to 5 s, for its parts, which load three at a time. | fix for the review's in-flight case offered as ByEzel93/opensro#1 |
| #3579 (@ByEzel93) | The skill tooltip catalogue builds views on demand. | live heap −33 MB |
| #3581 | Skinned cloth was skinned on the CPU and re-uploaded every frame. It is skinned on the GPU; the CPU runs only the solver's 20 Hz steps, bit for bit as before. | 200 geared players: 118 → 211 fps |
| #3582 | Light effects behind an occlusion query drew in a separate 4K pass every frame. They draw in the main pass except on query frames. | GPU 11.7 → 6.2 ms a frame (Jangan gate, 4K) |
| #3583 | Every walker's path was scanned end to end several times a frame. A path is measured once per publication. | 215 walkers: 53–67 → 137–144 fps |
| #3584 | Effects held by a model out of view kept simulating, and world cloth kept stepping. They stop, as the original does (A9EFB0). | tomb B1 main thread 4.95 → 3.28 ms |
| #3585 | Every batch kept its own GPU copy of each body part and worn item. They share one, charged once. | 200 players: refused 132 → 86 |
| #3595 | Wherever a light effect behind a query is in the scene, the character renderer prepared the whole frame twice. It is one pass. | tomb B1 686 → 794 fps, Jangan gate 596 → 690 fps |
| #3599 | Every cloth wearer's skeleton was built on the CPU, and a solver step skinned every pin. The GPU samples cloth batches' palettes; a step re-anchors the 4.8% of pins it reads. | 200 players: 198 → 239 fps; palette uploads 925 KB → 0 a frame |
| #3600 | The repository's bench had no crowd. fps-bench --at crowd stands up to 32 real players. |
|
| #3632 | A cloth step re-anchored every pin and compared every pin with its anchor, though it moves about one in twenty. It touches only what it can move. | 200 players: main thread 5.14 → 4.89 ms at 60 Hz; solver alone 85 → 36 ms/s |
| #3633 | Each admitted clip re-measured every assembly of its body. It is cached, bit-identical. Ported from @Edynu. | measured by @Edynu while peers act: 18 → 21 fps |
| #3639 | Since #3574 a render plan re-read every key time of every clip of its body, and an admitted clip re-plans every assembly of the body. The renderer keeps each clip's charge. | a plan of the Chinese male body (40 clips): 0.42 → 0.009 ms, same charge |
| #3641 | Step 0. fps-bench --gpu-process: the CPU time Chrome's GPU process spends per frame, from a trace the bench takes. |
see "What a frame costs now" |
| #3643 | Step 1, first part. Every GPU animation stream wrote its own small input buffer every frame. All streams share a staged slab, written once per frame. | 200 players: writes 532 → 339 a frame; Chrome's GPU process 2.35 → 2.12 ms a frame at 60 Hz; main thread unchanged |
| #3655 | Step 2. Pose order read each actor's keys in the comparator, over all 512 frame actors. It reads each key once, for the needed actors only; the order is the same. | evaluateNeededPoses 11.2 → 6.0 ms/s |
| #3656 | Step 2. Per-model facts (a group's draw tier, the material clocks' bytes and flags) were recomputed every frame. They are set when the model is admitted. | the material clocks' step 8.8 → 4.7 ms/s |
| #3657 | Step 6, first part. A tick digest over all 1,043 effect programs as the exactness oracle, and a per-model plan the tick reads. | digest unchanged; a sixth fewer collections, no time gain by itself (the flat storage that follows is where it is expected) |
In review
| Pull request | What it fixes | Measured |
|---|---|---|
| #3601 | A body's palette was charged once for each of its 9 parts. Each shared stream is charged once. | 200 players on main: refused 132 → 124 |
| #3619 | Every dress wearer kept a full copy of the dress mesh. Wearers share its vertices and indices; each keeps its own skin table. | 200 players, everything merged: refused 73 → 0 |
| #3666 | The UI. Every text call of a HUD rebuild built its memo key by joining strings, and the overlap pass copied every quad. The key is hashed fields; the pass copies only what it changes. | 200 players, half walking: the text functions 14.9 → 8.4 ms/s; a HUD's text replayed in Node 170 → 67 µs |
| #3663 | The UI. Every HUD rebuild scanned all entities for each name board's owner; only a companion's board uses it. | 200 players, half walking: the HUD's step 28.0 → 11.6 ms/s (0.3 ms a frame) |
| #3664 | The budget. A pose was charged one palette per primitive; it stores one per binding. The bindings are cached beside #3639's timelines, so a re-plan stays as cheap. | a player body's pose 69 KB → 47 KB; about 4.4 MB of the 64 MB back at 200 players |
| #3654 | Step 1, second part. The character renderer rewrote each clocked material uniform with its own write every frame. They share a staged slab of their own, written once per frame. | 200 players: writes 352 → 62 a frame (540 before #3643); GPU process 2.28 → 2.16 ms a frame; updateEquipmentGlow 5.9 → 2.4 ms/s |
| #3688 | A fix found on the way. An actor snapshot row never took a later boneRotation, so the spine aim of a ranged skill (bows, crossbows, many monsters' ranged attacks) either never reached the pose or froze at its first value. The row follows its source. |
player-visible; two tests fail without it |
| #3672 | Step 6, second part. A particle graph was one object per element and allocated on every tick. It ticks over typed arrays laid out once, and writes its own GPU records; a stream copies them as a block. The catalogue digest is unchanged: one commit changes only what is hashed, the next changes the tick and leaves the fixture alone. | 200 standing players with glows: the particle code 90 → 38 ms/s (0.86 ms a frame); a glow's tick 62–77 → 46 µs |
| #3679 (on #3654) | Step 5, first part. An equipment glow's clock moves from the draw's material uniform to a per-row state, read by a shader variant only merged draws use, so glow no longer splits batches. Four wearers in one batch against each alone on a real GPU: 0 differing pixels. | this crowd merges nothing until cloth is per wearer too; every other draw is unchanged, character for character |
| #3659 (on #3644) | Step 0. A bench crowd held from saved sessions, past the 32-peer cap: provision once, hold in a minute, up to 720 players in one interest area. | checked live with 8 accounts: resume, reuse, activity, retire |
| #3640 | Step 0. A standalone page that measures what a draw (in four forms, direct and from a bundle), a buffer write, a copy and a compute dispatch cost in the browser it runs in. | first reading below; the Windows run is wanted |
| #3644 | Step 0. The bench crowd can walk and chat from a seeded script (--act walk=0.5,chat=0.2 --seed N); each row records what ran. Crowd peers now acknowledge the transport stream: without that the server dropped a living crowd of 200 after 70 s. |
200 players for ten minutes: 16,763 clicks and 1,332 chat lines, all accepted |
| #3577 (@ByEzel93) | Per-frame sets and maps are new ones rather than cleared old ones. | no change at 60 Hz; +3% unlocked in the crowd |
| #3578 (@ByEzel93) | A same-region fast path in writeWorldVector. |
no measurable change after #3583 |
Found in a review of this series, to fix
The first fifteen pull requests of this series were read again line by line on 2026-11-15. Two findings, both fixed on 2026-11-16:
- #3574 (merged) made creating a render plan expensive.
characterPoseBytesnow reads every key time of every clip of the model (clipTimelineBytes): 0.37 ms a plan for a player body with 40 clips, measured in Node, against under 0.001 ms before. A clip admitted to a body builds the plan of every assembly of that body again (animation()inrenderer/characters/characters.ts), so one admission in a crowd of 200 players on one body costs about 75 ms, and more as the body's clips grow. A standing crowd does not show it: nothing is admitted after warm-up. Fixed in #3639: the renderer owns a per-clip cache of the charge. A plan of that body went from 0.42 ms to 0.009 ms, with the same charge. - #3595 (merged with the fix) left its query queue stale while characters are hidden. With the characters option off,
preparereturns before it clears the queue, sodeferredPlancan go on issuing queries from the last frame's state. Nothing visible changes. Fixed in #3595 itself (b5ea7937): the queue is cleared before the early return, with a test.
In progress
| Step | Work | State |
|---|---|---|
| 2 | Rows written on change: a batch whose rows did not change writes only its clocks (on #3679 and #3688) | in work |
| 2 | A socket (a weapon hand, an effect holder) reads only its node's ancestor chain, not the whole skeleton; bit-identical | in work |
| 6 | A particle stream uploads the rows that ticked, not the span between them | written and exact (branch perf/particle-ticked-rows on the fork), but held: in this crowd it takes the records from 466 to 262 KB a frame and 0.05 ms off the frame, because the client's streams are small. It is measured again once shared batches (step 5) make streams large |
| 6 | The compact cloth stream: a step uploads its movable vertices (1.6 MB → about 0.13 MB a frame), through a slot map; on #3619 | in work |
| 6 | Native check: when the original simulates a character's cloth at all (a per-compound gate at A9F0C7 and no cloth time out of view) | in work |
| UI | A label that did not move is not projected, repacked and compared again (about 19 ms/s standing, 9 to 10 walking) | in work |
| 1 | Every animation stream in one dispatch (192 today: about 0.6 ms a frame on D3D12, 0.27 ms on Metal; 1.8 to 2.0 ms at 600 players on D3D12) | designed: palette ranges in a slab, one skeleton and clip table, one job row per stream; one dispatch up to about 1,000 bodies. On the Mac's GPU today's sampler and the one-dispatch sampler agree on all 21.9 million palette words of a check; the same check is owed on D3D12 before the shader changes. Three pull requests, queued behind the lanes above |
| UI | Present the HUD's semantics only when they change (about 8 ms/s walking) | next |
| UI | The minimap's dots are what rebuild the HUD while a crowd walks; a motion pass rebuilds only them (28 to 33 ms/s walking) | designed; waits for the rebuild causes measured in the bench |
| 5 | Cloth per wearer in a shared table, the other half of what splits the crowd into 200 batches | after #3679 and the compact stream |
| — | #3601 reads palette bindings on every plan; once #3664 is in, it should read the same cache | follow-up |
| 0 | The 600-player hold (#3659) with monsters, and its measurement | after #3659 |
What a frame costs now
Read again on 2026-11-16, after the night's merges (main of that morning with the eleven open pull requests merged; the same scene and Mac):
| Per frame at 60 Hz | 200 standing | 100 walking, 40 chatting |
|---|---|---|
| Main thread | 6.7 ms (7.6 a day earlier) | 10.6 ms (11.5 to 12) |
| Chrome's GPU process | 2.2 ms | not read again |
writeBuffer calls |
54 (2.75 MB) | 68 (3.2 MB) |
| Compute dispatches | 193 | |
| Buffer copies | 275 | 462 (250 of them instance tables) |
The largest items now, in main-thread ms a second from CPU profiles:
| Standing | Walking | |
|---|---|---|
CPU poses (materialize): sockets, cloth wearers, and every walker's layered pose |
23 | 57 |
The cloth solver (cloth.ts step) |
22 | 25 |
Presentation (actor-motion.ts present) |
21 | 24 |
| The UI, every module | 20 | 83 |
of it the UI's draw (device/ui.ts), which encodes and uploads every frame even when nothing changed |
12 | 17 |
| Glow particle code (about 90 standing before #3672) | 42 | 62 |
The frame's uploads (writeBuffer; the standing profiles were slow sessions, see below) |
44 | 28 |
| Everything, of 1,000 | 462 | 747 |
The same shape on Windows. @Edynu ran his own 200-player crowd (Sun +12 gear, random avatars) on his PC (RX 6900 XT, Chrome 157, D3D12) with --gpu-process, on main of 2026-11-15, before that night's merges: the main thread is 100% busy at 19.8 to 22.2 ms a frame (44 to 50 fps) and Chrome's GPU process costs 3.1 to 3.7 ms (15 to 17% busy). So the main thread is the limit there as well, by a wider margin than on the Mac, and the 9 ms once read for the GPU process by hand does not reproduce. His spans: character preparation 13.6 ms, 8.6 of it uploads; planning 4.2; presentation 3.4; the UI 1.4; 246 poses a frame evaluated on the CPU, 134 of them for cloth wearers (#3599, merged since, moves those to the GPU). The same commit on the Mac with the crowd of this issue: 8.1 ms, 4.3 of it uploads; today's main with the open pull requests: 2.1 ms of uploads, with every glow drawing.
He then ran the same crowd on main of 2026-11-16 with every open pull request merged (branch bench/3563-all-open on the fork):
| His PC, his crowd | main of 11-15 | main of 11-16 + the open pull requests |
|---|---|---|
| Frame rate | 44 to 50 fps | 57 to 62 fps |
| Main thread | 19.8 to 22.2 ms | 15.8 to 16.7 ms |
| Chrome's GPU process | 3.1 to 3.7 ms | 3.1 to 3.3 ms |
| Character uploads | 8.6 ms | 5.2 to 5.5 ms |
| The UI | 1.4 ms | 0.06 to 0.1 ms |
| Poses the GPU samples | 43 | 174 |
| Glow particles drawn, ribbon vertices | 1,498, 3,397 | 2,730 to 2,820, 6,870 to 6,970 |
So a fifth to a quarter less main thread on that machine while it draws almost twice the glow, and the GPU process did not move. What is left in his spans: uploads 5.3 ms, planning 3.9 to 4.3, presentation 3.7 to 3.9, and 287 poses a frame on the CPU.
Two designs written from these profiles corrected what was assumed:
- Cloth. In a standing crowd no cloth step can be skipped: over 16,716 steps of real dresses none left its particles unchanged, the idle animation moves the pins every frame, and every step draws from the shared random stream. The original does the same work (a fixed 50 ms step, up to seven constraint passes, every particle copied with no change test: A9EFB0, A77B30, A77530). The waste is in the upload: a step writes the span from its lowest to its highest movable vertex, 12.4 KB, of which 0.87 KB changes.
- The UI. A walker's name board is not what rebuilds the HUD: boards are anchored quads the renderer places every frame. On 74 to 87% of a scripted walking crowd's frames the only thing that differed was the walkers' minimap dots. And the 12 ms a second of the UI's draw in a standing crowd is not an upload: every anchored label is a new object each frame, so its glyph records are rewritten and compared with what was uploaded, and come out equal.
So the order of what is left has changed: poses on the CPU, cloth, presentation and the UI are each as large as the glows were. The lanes under "In progress" follow that order.
The reading of 2026-11-15, which the plan was made from. With every pull request above merged, the 200 geared players in Hotan cost the main thread about 8 ms a frame at 60 Hz, and all 256 visible bodies draw. The render budget is still full: it admits 62 of the glow effects those players hold and refuses 191. One frame then issues:
| Per frame | Count |
|---|---|
| Draws, inside render bundles | 2,068 |
writeBuffer calls |
518 (1.3 to 2.5 MB) |
| Compute dispatches | 173 |
| Batches for the actors drawn | 214 for 318 |
| Actor table | 512 of 512 |
Buffer copies (copyBufferToBuffer) |
263 (3.5 MB) |
By buffer, counted on 2026-11-16 (the same scene; counts do not depend on load):
- Writes. 301 of them are per-batch material uniforms of 32 bytes each (
geometry-material), and 191 are skeleton inputs (animation-inputs). The rest: 23 palettes, 11 index buffers, a few for particles, water and the environment, and the upload arena itself (one write, 1.9 MB). - Copies. 129 go through the frame's upload arena: cloth skin tables 116 (1.6 MB), ribbon and cloth vertices 13. The other 134 are the particle pass copying each stream's instance table (58, 0.9 MB), bone table (56) and changed records (20).
Where the 8 ms goes (CPU profile of an unminified bundle, 60 Hz, idle machine; by source module):
| Work | ms a frame | Share |
|---|---|---|
| Glow particles: graph simulation, rows, ribbons (the 62 admitted effects) | 2.23 | 27% |
Character presentation: present for every entity |
1.63 | 20% |
| Batch preparation: rows, keys, material clocks | 1.09 | 13% |
| Device, UI, world, submit | 0.90 | 11% |
| Cloth: the 20 Hz solver of every dress | 0.76 | 9% |
| Planning: budget, grouping, ordering | 0.76 | 9% |
| CPU poses: sockets and layered poses | 0.56 | 7% |
| Other | 0.19 | 2% |
What it says:
- The cost follows the number of actors, every frame. A geared player is a batch of its own:
batchKeyadds the actor's id for cloth and for material clocks. Each batch keeps its own instance rows, palette stream, compute input and bind group, and one draw per primitive. - A standing player changes nothing between two frames but its clip time. The frame still presents it, plans it, rebuilds its batch key, compares its rows and writes its inputs.
- The GPU samples skeletons one stream at a time: one input write and one dispatch each. It samples single clips only; a layered pose (a blend, an action layer) falls back to the CPU. Our crowd stands still, so these numbers are the best case.
- A glow effect costs about 36 µs a frame, and three in four are not drawn. The 2.2 ms above is for the 62 effects the budget admits. All 253 would cost about 9 ms a frame and do not fit in 64 MB.
- The actor table is full at about 200 geared players. A larger crowd is not drawn today.
- Chrome's GPU process costs 2.35 ms a frame in this scene on the measuring Mac (
CrGpuMainCPU at 60 Hz, #3641; an empty field costs 0.76 ms). The main thread costs 7.6 ms, so here the main thread is the limit three times over. @Edynu measured 9.0 ms a frame in the GPU process for about 1,600 draws on Windows (RX 6900 XT); the Windows run of #3640 below does not find that much in the calls themselves. - What one call costs on this Mac (#3640, Metal, whole loop including the GPU process): a draw from a bundle 0.18 µs with a state change and 0.12 µs without; a small buffer write 0.65 to 0.8 µs; a copy out of the staging buffer 0.45 to 0.75 µs; a compute dispatch 1.4 µs; an instance of an instanced draw nothing measurable. So the frame's 2,068 draws are about 0.4 ms, its 535 writes about 0.4 ms, its 263 copies about 0.15 ms and its 192 dispatches about 0.27 ms. Almost none of that is main-thread time: a write costs the main thread 0.12 µs.
- What one call costs on Windows, D3D12 (#3640, run by @Edynu on an RX 6900 XT in Chrome 157 and Edge 157): a draw from a bundle 0.32 to 0.57 µs with every state changing, 0.006 to 0.07 µs with none, and 0.21 to 0.26 µs with only one kind of state changing; an indirect draw 2.3 µs, and an empty indirect slot the same; a small write 1.1 to 1.5 µs; a copy 0.3 to 0.8 µs; a dispatch about 3 µs. For this frame that is about 0.7 to 1.2 ms of draws, 0.6 to 0.8 ms of writes, 0.1 to 0.2 ms of copies and 0.6 ms of dispatches: 2 to 2.8 ms, against about 1.2 ms on the Mac. It does not add up to the 9 ms measured there by hand; that figure was probably the GPU thread's wall time with its waits, or the older build did more per frame.
fps-bench --gpu-process(#3641) reads CPU and wall apart. - One call varies by 0.35 ms between page sessions. The upload arena's single
writeBufferof about 1.8 MB a frame (1.6 MB of it the cloth's skin streams) costs about 0.09 ms in some sessions and about 0.44 ms in others, in every build (timed in the page: twelve sessions over three builds, five fast and seven slow). No change in this issue causes it, and it is larger than most single steps here, so the pull requests from #3663 on report function times from CPU profiles, not frame times. The cure is to upload less: the cloth streams are that 1.6 MB. - On main alone no glow ticks at 200 players. The render budget still refuses the glows there, so the effect work below shows only with the open budget pull requests merged too (#3601, #3619, #3664).
- So on this machine the main thread's 8 ms is the client's own work, not WebGPU calls: preparing rows nobody changed, presenting every entity, simulating glows. Steps 2, 4 and 6 are where the main thread comes down; steps 1 and 5 bring the GPU process down.
A crowd that lives costs half as much again. With the same 200 players, 100 walking and 40 chatting (#3644), the main thread goes from 7.5 to 11.5 to 12 ms a frame and the GPU process from 2.35 to 3.0 ms; the frame's p99 goes from 17.6 to about 30 ms. Two CPU profiles of the same scene say where the extra 4.3 ms goes:
| Work | Extra per frame |
|---|---|
| The UI: while anyone walks, the whole HUD is rebuilt on almost every frame (about 48 rebuilds a second against 0.5 standing; chat adds only about 2 a second) | about 1.3 ms |
| Effect ticks of moving holders, and their records | about 0.9 ms |
| CPU poses: a walker that blends between clips falls back to the CPU | about 0.7 ms |
| Walking paths and walkers' presentation | about 0.3 ms |
| Collections and the rest | about 1.1 ms |
This scene, not the standing one, is the baseline from here on.
So what is left is no longer a list of single faults. The frame is rebuilt for every actor every frame, and that is what the plan below changes.
Plan
Target
A crowd that walks, fights and talks: 600 players and 400 monsters in view. No test of ours holds that scene today.
A native client shows what the content allows. @Edynu's C++ and Vulkan client draws that scene with real bots at 2.98 ms a frame: game thread 3.5 ms, render thread 1.3 ms, 21 worker threads, RX 6900 XT (his numbers). A browser pays more for each GPU command than a native client does, so the target is a frame budget, not his frame rate:
| Level | Hardware | Main thread, p95 | GPU process |
|---|---|---|---|
| Must | mid-range: 4 to 8 cores, GTX 1060 class | 8 ms or less | 6 ms or less |
| Goal | desktop class: M5 Pro, RX 6900 XT | 4 ms or less | 3 ms or less |
The repository's own budget is stricter still: docs/guides/PROFILING.md asks for under 2 ms of main thread in every scenario. This plan takes that rule to a crowd.
How the work is done
- Small pull requests against the renderer that exists. Each subsystem is replaced in place. There is no second renderer behind an option and no rewrite.
- Logic is exact; the picture is held to a named level. A step that reorganises CPU work gives today's output bit for bit, held by a test that fails when it does not. A step that moves a value to the GPU is held to its CPU reference by a stated threshold, the rounding-only level
docs/agents/AGENT-COORDINATION.mddescribes, as the GPU pose owner is today (tests/browser/gpu-animation.test.mjs: palette error under 0.0001), and its pull request names it. - Two visible levers are proposed, not assumed. Far actors could refresh their animation less often, and cloth could stop past a set distance. Each would ship as its own tolerance level, approved or refused by the owner on its pull request. Until then every step is exact.
- Clip times stay on the CPU. One pass over flat arrays computes them with today's expression, and one write sends them. That is exact and cheap: one subtraction and one store per row.
- Nothing here needs a hosting change. Threads come last, and only if the measurements still ask for them. Their first form needs no cross-origin isolation: the 20 Hz effect ticks run on one worker and hand their records over in transferable buffers. Random numbers need no change either: every effect already keeps its own cursor into the shared 5,000-entry table, so a kernel draws the same numbers wherever it runs.
- The limits stay as guards. The work brings down what one actor keeps until a 1,000-actor scene fits under the render budget, instead of raising the budget. The actor table grows with the scene instead of stopping at 512: a static read of the v1.150 client found no count limit in the original (A0E6D0, A0D760). What fills the budget today is glow particle state: every element of an effect is charged 640 bytes, up to 327 KB for one glow. Step 6 brings that down.
- TypeScript only. No new language or toolchain.
Steps
| Step | What changes | Expected at 200 geared players |
|---|---|---|
| 0. Measure | A crowd that walks, fights and talks, scaled to 600 + 400. A page that measures what Chrome charges for a draw in four forms (with a state change, without one, indirect, an empty indirect slot), for a write and for a dispatch, run on macOS and on Windows. GPU-process time in every run. The census counts the distinct (mesh, material) pairs in view. Count budgets (draws, writes, dispatches) in CI: counts do not depend on load. | The real baseline for the target scene, and the numbers that decide the shape of step 5 |
| 1. One upload, one dispatch | Skeleton inputs and the per-batch material uniforms are staged in shared slabs (buffer-slabs.ts) and written once per frame; the first pull request does the inputs. Then every stream is sampled in one dispatch: skeleton and clip data sit in shared buffers, by offset, and the palettes come out of one pool. |
Dispatches 192 → 1 to 3; writes 535 → under 20. Measured so far (#3643): writes 532 → 339, GPU process −0.23 ms a frame. With #3654: writes 62. On the Mac the whole step is worth about 0.8 ms of GPU process and little main thread; on D3D12 about 1.2 ms, half of it the dispatches |
| 2. Rows written on change | A batch whose rows did not change does no work but its clocks: the JSON of batchPoseKey, the row comparison and the rewrite go; pose order, per-model constants and material writes stop being recomputed. The GPU sampler takes blends and masked layers last, and only if a census of layered poses asks for it. |
About −0.9 ms: the step's scope is 2.3 ms and five exact pull requests bring it to 1.4. What stays is the fixed cost of 200 one-row batches, which step 5 removes |
| 3. Sockets on the GPU | A weapon, shield or attached effect takes its transform from its holder's palette on the GPU. A CPU pose is built only for what needs a position on the CPU: a cloth step, an emitter at 20 Hz, a pick. | −0.5 ms |
| 4. Presentation on change | present runs for an entity whose inputs changed or whose timer is due, not for every entity every frame. |
About −0.5 to −0.7 ms: present itself is 0.75 ms of the step's 1.63; the rest is per-entity passes around it |
| 5. Shared batches, and cheap draws | Per-actor state (fade, tint, glow, material clocks, cloth) moves from the draw to the instance row, one state per pull request, so it stops splitting batches. Then the batch is the (mesh, material) pair, and everyone who wears a part shares its draw. Meshes share vertex and index pools and textures sit in arrays with a material table, so one draw follows another without a state change: on D3D12 such a draw is almost free, and one remaining state change keeps it at 0.2 to 0.3 µs, so the two are done together. A batch whose rows did not change is not prepared at all. The actor table grows with the scene. Indirect draws are not used: on D3D12 each costs 2.3 µs, an empty slot included. | Draws follow the distinct parts in view, not actors × parts. A varied crowd shares few parts, so there the gain is the cost of each draw: on D3D12 about 0.6 to 1 ms a frame today and 2 to 3.5 ms at the target scene's 7,000 draws. The target scene draws in full |
| 6. Simulations at their own tick | Glow particle graphs and the cloth solver run on flat arrays and step at 20 Hz when due, with today's results. Ribbon strips are built on the GPU. If the glows still cost too much after that, their simulation moves to the GPU under the rounding level. | A glow from about 36 to about 16 µs a frame: 2.2 → about 1.0 ms for the 62 the budget admits today. Sizing storage by peak occupancy then admits more of them |
| 7. Labels on the GPU | Name tags and bars take their position in the vertex stage from the actor row. | −0.2 ms; about −1 ms at 1,000 actors |
| 8. Threads, if still needed | First the 20 Hz effect ticks on one worker, with transferable buffers. A small worker pool over shared memory only if that is not enough. | Only if the main thread is still above the goal after steps 1 to 5 |
The estimates come from the profile above. Each one is replaced by a measurement when its step lands: a step closes when the walking crowd shows its gain and a test proves the output unchanged. If a step gives less than half of its estimate, the plan is reviewed before the next one starts.
Order: step 0 first. After it, three lines move independently: GPU traffic (1, 2, 3, 5), presentation (4) and simulations (6, then 8). The first measurements of step 0 put the main-thread steps (2, 4, 6) ahead on the measuring Mac; the Windows numbers decide how early steps 1 and 5 have to finish.
Why threads moved to the end
The first version of this plan started with worker threads. The profile above changed the order: most of the frame is work that can be removed, not only moved, and a worker cannot touch the draw path, because one thread owns the GPU device.
@Edynu's plan reaches the same point from the other side (branch, plan): workers alone about double the frame rate, and past that the draw path has to shrink to a few uploads and few draws. The later steps build on his work:
- step 5: the end state section 5.9 of his plan describes (shared mesh pools, instance rows per actor and part, few draws). The pooled renderer he prototyped for it is lost, so the step is built from that description on today's device layer;
- step 6: his flat kernels for particles, cloth and poses, which are exact when they run inline;
- step 8: his pool: shared tables with one writer per byte, fork-join phases, an inline fallback.
Already covered on main another way, so not ported:
- walking histories: #3552, #3583;
- the deferred continuation: removed by #3595;
- cloth on workers: moved to the GPU by #3581 and #3599;
- the larger render budget: #3570, #3574, #3585, #3601 and #3619 fix the accounting instead.
Three more of his single-thread fixes are ported and exact, but show no measurable change in a standing crowd. They wait for the walking crowd of step 0 and belong to step 4:
- clip lookups through a set:
perf/presentation-clip-sets; - per-frame motion names made once:
perf/presentation-motion-names; - no string rebuilding in group ordering and batch admission:
perf/batch-string-keys.
Notes
- Glows (step 6). With #3619 every visible body draws, and the glows became the largest single item: 2.2 ms a frame at 200 players for the 62 effects the budget admits (it refuses 191), about 1.2 ms of it the simulation (
advanceParticleGraphat the original's 20 Hz,particleElementMatrixbetween ticks). It is the native rule, not waste. An earlier note here said 0.2 ms; that was measured while the budget still refused nearly every glow. The 28 rare-item glow effects are small trees of element groups, and in 27 of them every group rides its holder (position, turn and frame), so nothing in them depends on where the holder stands. Each effect draws its random numbers from one cursor, in element order: a GPU version has to reproduce that order, which is why it is not the first move. - What the designs of steps 2, 4 and 6 found (2026-11-16, each checked against the CPU profile).
- A standing geared player changes more than its clip time: its glow clock moves every frame, an idle fidget about every 15 s makes it a two-layer pose the CPU builds, and its cloth solver steps when due.
- A looping clip's time is not
now − start. The dispatch keeps a cursor per layer in whole milliseconds, advanced by the frame's delta with the remainder carried, and its ranges also drive sound cues, foot contacts, animation-triggered effects and the material clocks. So the flat clock pass keeps each layer's cursor and carry, in one owner on the presentation side that the renderer reads. presentis 0.75 ms of the presentation step's 1.63 ms; the rest is the renderer's snapshot copy, model emission, events and selection.- A glow's cost is 43% the 20 Hz tick, 27% ribbons rebuilt on the CPU every frame, 13% the holder's socket (a CPU pose of the holder), the rest staging and bookkeeping. An element really takes about 2.9 KB of heap per occupied slot while the budget charges 640 bytes per capacity slot, and only 26 to 34% of capacity is ever occupied.
- Found on the way, a defect and not a cost:
actor-snapshots.tsnever updatesboneRotationafter a row's first publication, so a spine aim that starts later never reaches the pose. It gets its own fix before step 2's rows-on-change change, because it changes what is drawn.
- What the design of step 5 found (2026-11-16).
- Draws are cheap on the measuring Mac: the scene's 1,320 character draws are about 0.24 ms of GPU process, and the target scene's 7,000 would be about 1.3 ms. What pays there is the main thread's fixed cost per batch, about 1.7 µs a batch a frame after steps 1 and 2.
- The test crowd shares almost everything: 15 assemblies of 19 meshes and 17 materials. Two things split it into 200 batches, the glow clock in the draw's uniform and cloth per wearer. With both in per-row storage it is 15 to 30 batches. A varied crowd gains nothing from that, so the second lever is that a batch whose rows did not change is not prepared at all.
- A fade cannot move into the row: a fading draw needs a blended pipeline and far-to-near order. Fading actors keep today's batches.
- The batch as a (mesh, material) pair, shared vertex and index pools, texture arrays and one draw by vertex pulling all wait for the Windows number; the design gives the threshold for each.
- The 512-row actor table is full at 200 players mostly because of about 305 glow-effect actors; the target scene is about 2,100 actors. A body is charged about 105 KB, 22 KB of it palettes charged per primitive where the pose stores 3 KB per binding.
- Variety (step 5). The native client's run with real bots (see Target) drew 1,779 draws for 1,850 instances: players in different gear share almost nothing. Its uniform test crowd drew 100 draws for 2,423 instances. So instancing alone will not carry a real crowd; the cost of each draw has to come down as well.
- Cross-origin isolation (step 8, shared memory only).
SharedArrayBufferneedsCross-Origin-Opener-Policy: same-originandCross-Origin-Embedder-Policy: require-corpon the page; that pair works in Chrome, Firefox and Safari. The repository side is ready for it: the play page loads only same-origin resources (scripts and styles under/src, images under/assets, packs from the page's own origin), and outgoing links are not affected. Two points stay open until the step starts, and nothing before it depends on them: whether the game's WebSocket and WebTransport connect unchanged on an isolated page, and whether anything in front of/assetsin production serves from another origin.
What the browser gives, checked November 2026
- One thread owns a
GPUDevice: sharing and transfer were removed from the specification (gpuweb#2629, still so in gpuweb#5549). Workers can compute; one thread encodes. - No multi-draw indirect outside a Chrome flag, and no bindless textures yet (a draft, with a flagged Chrome prototype). Textures keep splitting draws; texture arrays of one size are the way around it if step 5 needs one.
- A render bundle saves the page's CPU: its commands are validated and encoded once (render bundles). The GPU process still executes its draws one by one.
- An indirect draw is not free either. Dawn validates indirect draw records before every pass that issues them, directly or through a bundle: one compute dispatch when all records sit in one buffer (indirect draws, Dawn). A record with zero instances still costs its draw on the CPU, and a non-zero
firstInstancein a record needs the optionalindirect-first-instancefeature. Measured (#3640): on D3D12 an indirect draw costs 2.3 µs from a bundle or in a pass, empty or not, seven times a bundled draw with every state changing; on Metal it costs about what a direct draw does. - A binding in a draw's own bind group is paid by every draw that binds it. Measured on Metal with a scratch copy of #3640's page: one more storage buffer in a bind group that changes each draw adds about 0.05 µs a draw (0.19 → 0.24 µs from a bundle), nine more textures about 0.06 µs together. So per-row tables go where only their draws bind them, and resources every draw shares are worth a group of their own, set once.
- No published measurement of what one draw costs in Chrome's GPU process was found, and no browser demo of 1,000 bone-skinned characters with a stated frame rate. #3640 measures the first: on Metal an indirect draw costs more than a direct one (0.14 against 0.12 µs from a bundle) and an empty indirect slot still costs 0.10 µs. Because of the second, every step is checked by measurement.
The server (not part of this issue)
The server tick is the maintainer's own measure-find-fix-prove work, measured live at peak hours and stress-tested with up to 500 bots (opensro.online): 41 ms at 52 players on 2026-10-31, 42 ms at 104 players on 2026-11-14, with a goal of 10 ms on a full server. @Edynu's report of crashes at about 500 bots with a tick over 200 ms fits that per-player cost.
How to measure
node tools/perf/bench/fps-bench.mjs --at crowd --crowd 32: the repository's crowd scenario (#3600).tools/perf/bench/crowd-host.mjs: holds a crowd for longer runs.- Compare bench bundles (
build:bench,vite preview --mode bench) in A-B-B-A order on an idle machine. Census numbers (characterStats()) do not depend on load; frame times do. - In review:
--gpu-processfor the GPU process's CPU time per frame (#3641),--act walk=0.5,chat=0.2 --seed Nfor a crowd that walks and chats (#3644), andtools/perf/constantsfor what one WebGPU call costs on a machine (#3640).
Original report and analysis (2026-11-15)
## Report (player, 2026-11-15)On the live shard the client stutters and freezes for me in crowded places: Hotan with many players who hold Seal of Sun weapons, and spots with many monsters. This happens on an Apple M5 Pro at the lowest settings. It does not happen when my character stands alone.
I rebuilt that crowd on a local stack and measured it. This issue gives the full picture and a proposal. It contains no fix.
Result in one paragraph. A player who holds a Seal of Sun weapon and shield costs the client about 1.6 MB of its 64 MB character render budget and about 0.47 ms of main thread per frame. So the 60 Hz frame budget is spent at about 27 such players in view, and the memory budget at about 40. Past that, glows and then characters stop drawing. At 200 players no character is drawn at all, the player's own character included, while the main thread still works 16 to 20 ms per frame.
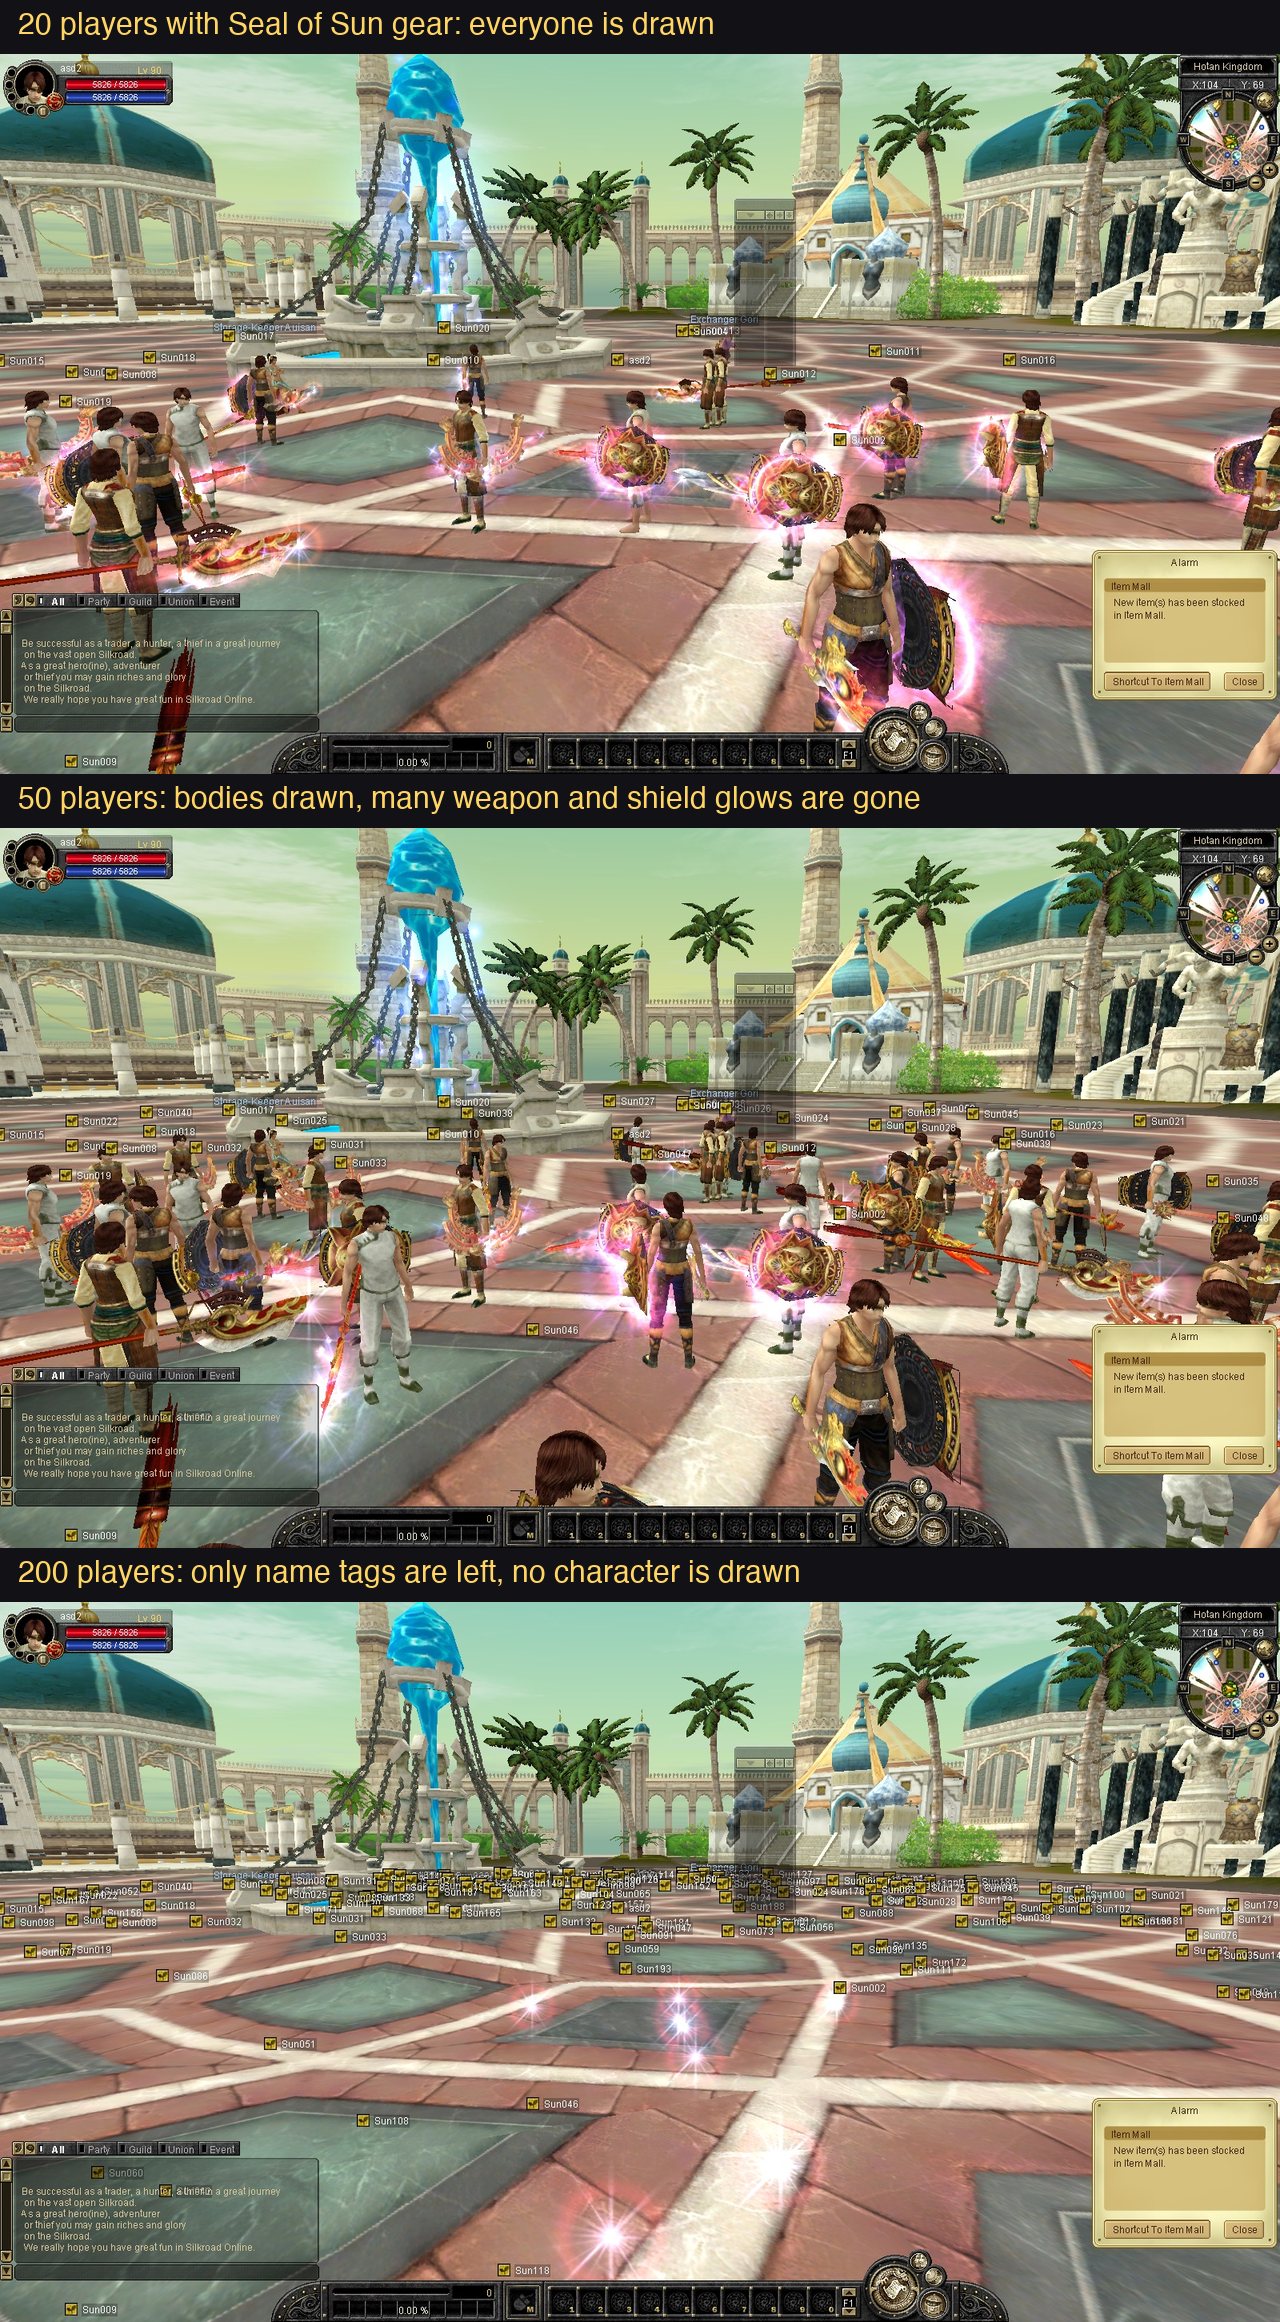
Single frames: alone, 20, 50, 200.
How the scene was built
- Stack:
pnpm localfrom mainc133289d, on a scratch world (SRO_LOCAL_STATE_ROOT), withSRO_BENCHMARK_FIXTURE_CONTROL=1. - Crowd: 200 accounts made through the provisioning API, one character each (
CHAR_CH_MAN_ADVENTURER, level 90 by the fixture loadout).- Creation weapons cycle through SWORD, BLADE, SPEAR, TBLADE and BOW. Protectors cycle through HEAVY, LIGHT and CLOTHES.
- Each character stands at a fixed-seed random spot within 95 units of Hotan's plaza (region 23687, x 1040, z 690), placed with
/development/benchmark-fixture/reset.
- Gear: with the stack stopped,
store.SwapItemsOffline(the callsro-swap-sunuses) turned every creation weapon and shield into the degree-9 Seal of Sun item of the same kind (ITEM_CH_*_09_C_RARE, +0). That is 282 items. The observer character holds a Sun sword and shield too. - Peers: each peer holds its place over a real GameWorld socket with the production codec, as
tools/perf/core/crowd.mjsdoes. Peers stand still. - Observer: Chrome 157 on macOS (Apple M5 Pro), standing in the plaza, every option at its default.
- Timings come from the bench bundle (entry
index-B7RyBhjj.js, replay off) at 1600×900, DPR 1, paced 60 Hz, through the repo'sinstrumentandmeasure. - Counts come from
runtime.characterStats(). - The 200-player state was also checked by eye in the system Chrome on the dev server: it shows the same picture, and the same counters.
- Timings come from the bench bundle (entry
What happens
runtime.characterStats() in the plaza:
| Sun players | Actors | renderBytes |
deferredActors / visibleActors |
Character draws | On screen |
|---|---|---|---|---|---|
| 20 | 71–117 | 34.7–36.3 MB | 0 / 68–104 | 227–235 | Everyone, with glows |
| 50 | 155–201 | 64.0 MB (full) | 63–68 / 152–186 | 467–469 | Bodies drawn, many glows missing |
| 200 | 512 (the cap) | 64.0 MB (full) | 265 / 273 | 2 | Name tags only |
Main thread (bench bundle, two 10 s windows per row, no profiler):
| Sun players | Main thread per frame | Frames per second | Frame interval p99 | Particles / ribbon vertices per frame |
|---|---|---|---|---|
| 0 (own Sun sword and shield) | 3.8 / 4.1 ms | 60 / 60 | 18.6 ms | 274 / 340 |
| 20 | 13.2 / 13.7 ms | 60 / 59.9 | 24.3 / 25.5 ms | 1,945 / 5,328 |
| 50 | 21.2 / 13.4 ms | 45.6 / 59.4 | 40.5 / 28.6 ms | 637 / 1,382 |
| 200 | 16–20 ms (four runs) | 48–57 | 32–37 ms | 16 / 0 |
How to read these:
- From 0 to 20 players the main thread gains about 9.5 ms per frame: about 0.47 ms per Sun-equipped player.
- At 50 and 200 the numbers stop growing only because the budget drops work. The 50-player frame already draws fewer particles than the 20-player frame.
- At 200 the client spends 16 to 20 ms per frame and issues 2 character draws.
Cause 1: the render byte budget is charged in two phases, emitters first
The relevant limits are in foundation/animation/character-budget.ts: CHARACTER_ACTORS = 512 (line 30) and CHARACTER_RENDER_BYTES = 67108864 (line 41).
In runtime/renderer/characters/characters.ts:
advanceParticles(line 1471) admits emitters first. Each emitter is charged its particle storage plus the pose bytes of its whole attachment chain, so the body that holds the glow is charged here too. Admission stops atCHARACTER_RENDER_BYTES(line 1492).planBatches(line 1601) then starts fromrenderBytes = particles.bytes + materialClocks.bytes()(line 1609). Any actor whose batch no longer fits is counted indeferredActorsand skipped (line 1631).
So the glows fill the budget before any body is planned. The actor room is nearest-first with the local player at the front (character-selection.ts), but that order does not help here: by the time bodies are planned, the bytes are gone. That is why the player's own character is not drawn either.
Two more facts:
- A deferred actor still costs CPU.
character-selection.tssays animation and presentation run every frame, and the 200-player row shows it. - Nothing tells the player. The only sign is
characterStats().deferredActors.
Cause 2: what one actor is charged
To see who fills the budget, I added a temporary census to stats() on a local copy (not in any branch; I can share it). It lists plan.poseBytes, plan.particleBytes and plan.batchBytes per model. With 20 Sun players (nothing deferred, 36.3 MB):
| Model | Actors | Pose | Particle storage | Batch storage (one actor) |
|---|---|---|---|---|
| Player body (assembly; 60 nodes, 54 clips, 3,910 channels) | 21 | 357 KB each | 0 | 325–369 KB for the first of an assembly, about +60 KB for the next |
system/system_rareshield_c.efp |
9 | 7 KB | 470 KB each | 314 KB each |
system/system_raretype_a_step3.efp |
9 | 9 KB | 330 KB each | 311 KB each |
system/system_raretype_b_step3.efp |
8 | 8 KB | 326 KB each | 308 KB each |
system/system_rarebow_c.efp |
4 | 8 KB | 291 KB each | 224 KB each |
Scenery effects of the plaza (map/*.efp: lamps, frames, portal) |
51 | small | small | small |
Where the bytes come from:
- Pose, 357 KB per body.
characterPoseBytes(line 49) charges 80 bytes for every channel of every clip: 3,910 × 80 = 313 KB of the 357 KB. A standing character plays one clip. - Glow particle storage, 290–470 KB per glow.
character-render-plan.tsline 72 charges 320 bytes per emitter slot and 640 per graph slot for the capacity (290–485 particles per glow). The 21 Sun holders together showed about 1,945 live particles, about 90 each. - Glow batch storage, 220–314 KB per glow.
characterBatchBytes(line 85) charges every emitted instance its own palette (the comment says "the unshared worst case") and every ribbon its full strip. - Body batches. The 21 player bodies were 16 distinct assemblies, because an assembly is one body plus one set of worn items. On the live shard a crowd can hold as many sets as players.
Sums:
- A player with a Sun weapon and shield is charged about 1.8–2.1 MB. Without a shield, about 1.0–1.4 MB. The measured average was about 1.6 MB.
- The 64 MB budget is therefore full at about 40 such players.
- 200 of them would need more than 300 MB under this accounting.
- By the same census, 200 bodies with no glow at all are charged 72 MB for poses alone. I did not check that case on screen.
The actor cap is hit too: 200 bodies + about 360 glow actors + 51 scenery effects + NPCs is more than 512.
Cause 3: the glow is simulated per holder on the main thread
CPU profile with 20 Sun players (dev server for line names, CPU profiler on, 45.9 fps, 21.1 ms per frame). Inclusive time, in ms per second of main thread:
| Cost | ms/s |
|---|---|
prepare (renderer/characters/characters.ts) |
733 |
↳ advanceParticles |
433 |
↳ advanceParticleGraph (particle-graph.ts) |
180 |
↳ particleElementMatrix |
157 |
↳ writeGraphRecord |
82 |
↳ linkElement |
54 |
↳ prepareGroup |
203 |
Frame draw (frame.ts) |
230 |
↳ finishDeferred |
159 |
↳ drawParticles / writeParticleRow |
94 / 86 |
↳ drawRibbon |
54 |
transformFor / attachedTransform |
62 / 55 |
Pose (materialize, evaluateNeededPoses) |
51 / 47 |
About three quarters of the frame is glow work: the particle graph of every holder is ticked, linked and written separately. The 30 heavy glow actors of this scene are four distinct programs.
For comparison: 200 standing players with creation weapons (no glow)
Bench bundle, 1600×900, paced: 56.6 fps, 11.7 ms of main thread per frame standing, 17.1 ms while the camera turns. The dev-server profile's largest costs, in ms/s:
| Cost | ms/s |
|---|---|
Cloth (cloth-vertices.ts update, through drawCloth) |
85–88 |
actor-motion.ts present |
94 |
writeBatchRows |
70 |
palette-streams.ts update |
59 |
| Interface prepare and character labels | 46 + 16 |
actor-appearance.ts resolve |
50 |
writeBuffer |
49 |
resources.ts ready |
21 |
Limit of this row: I took no screenshot or characterStats() for it, so I do not know how many of the 200 bodies were drawn.
What this report does not cover
- GPU time. Another GPU workload ran on the machine during the session, so I claim no GPU number here. For the same reason, treat the "about 70 fps uncapped at 3808×1892" remark in #3552 as unverified. I will measure GPU cost again on an idle machine.
- The live shard. Everything above is a local stack. I do not know how many players the live shard sends a client at once.
- Movement. The peers stand still. Walking adds the cost that #3552 reduced and the path scan in
pose-presentation.ts. - Variety. Every peer is the same body with one of 15 gear sets. A live crowd has more distinct assemblies.
- The original client. I traced nothing for this report.
effect-room.tsalready records that the original keeps every decoration (85C020, an unbounded list). My own experience is that the original keeps drawing far larger crowds. - The Jangan cave (#2788). Not measured here. A single heavy glow costs about 0.3 ms per frame in these numbers, so a few glows in a room do not explain that report on their own.
Proposal
WebGPU is not the limit here: every limit above is the client's own constant or its own per-actor work. The parts below are ordered from small to large. They are proposals from these measurements and from the code I read, which is not the whole renderer. None of them is measured.
1. Fail in the right order, and say so.
- Under the byte budget, plan bodies before decorations: the local player, its party, then nearest first.
- Let quality give way before presence: glow particles first, then ribbons, then cloth, then animation rate. A character should lose its glow before it disappears.
- Show
deferredActorsin the developer diagnostics, and raise a degraded report when it is not zero.
2. Charge an actor what it uses.
- Pose: keep per-actor state for the clips that play, not 80 bytes for each of 3,910 channels. That is about 50 KB per body instead of 357 KB.
- Glow: size particle history and batch slots by live particles from a shared pool, not by each holder's full capacity with an unshared palette per instance.
- With both, my estimate is that the same 64 MB holds several hundred Sun-equipped players.
3. Simulate a glow once per program, not once per holder.
- An equipment glow is a looping program with no input from its holder except the attachment matrix. Tick it once per program (a few phase offsets keep holders from pulsing together) and draw it instanced, one instance per holder.
- CPU cost then follows the number of distinct programs (four in this scene), not the number of holders.
- Ribbons and any element that trails behind a moving holder need the holder's motion. Keep those per holder, and only near the camera.
- This needs a native check first: does the original simulate each holder's particles in world space? If so, a shared simulation is exact for a standing holder and an approximation for a moving one.
4. Move what is left of the simulation off the main thread.
- The renderer already has a compute pass that presents particles and one that samples skeletons. Emission and advance can live there too, or become stateless (a particle's state computed from its birth time and seed in the shader). The main thread then writes per-holder matrices only.
5. Level of detail by distance or screen size.
- Far holders: one additive sprite or an emissive tint instead of a particle glow, no cloth, pose at a reduced rate (
animationLodexists). - Very far: no decoration, then a billboard of the body.
- This is port-only behaviour, so it belongs behind an Experimental row, as the shared actor room is.
6. Draw worn items as instanced parts.
- Today one assembly is one body plus one set of items, so a crowd of differently dressed players is one batch per player.
- Drawing each item mesh instanced across its wearers, with the wearer's palette, makes draws follow the number of distinct item meshes.
7. Stop per-frame work for actors that did not change.
- A standing crowd pays cloth, motion presentation, appearance resolve, label projection and row writes every frame. Cloth could run only near the camera or on the GPU. The rest can be kept until an input changes.
8. Measure crowds in the bench.
fps-benchhas no crowd scenario and runs at 1600×900, so none of this shows in its 500 fps goal.- I can contribute the fixture used here: the crowd script, the offline gear swap, and a bench variant that reports
characterStats()and worker message cost beside the frame times.
- Ngôn ngữ chính
- Go
- Star
- 97
- Fork
- 61
- Merge trung bình
- 4 giờ 14 phút
- Pull request đã merge (30 ngày)
- 913
Chuẩn bị môi trường
- Không có Dockerfile hay tệp Docker Compose
- Có mẫu pull request
- Đọc hướng dẫn đóng góp
Bắt đầu từ đâu
- Đọc hết issue, rồi đọc hướng dẫn đóng góp của dự án.
- Bình luận trên issue rằng bạn sẽ nhận — tránh hai người làm cùng một việc.
- Fork repository và làm thay đổi trên một nhánh.
- Mở pull request có tham chiếu số hiệu của issue.
Issue khác của opensro-dev/opensro
-
area: client enhancement priority: low
Độ khó 2/5 1-3 giờ Mức phù hợp với người mới 75/100
opensro-dev/opensro#3681 ·
Maintainer thường phản hồi trong vòng 1 ngày
-
area: client bug priority: low
Độ khó 2/5 1-3 giờ Mức phù hợp với người mới 78/100
opensro-dev/opensro#3228 · 1 bình luận ·
Maintainer thường phản hồi trong vòng 1 ngày
-
Format one minified client file with dprint (ongoing: one file per PR)Có thể đã có người làm Có pull request liên kết đang mở hoặc đã được merge. Đang mởarea: client enhancement good first issue priority: low
Độ khó 2/5 1-3 giờ Mức phù hợp với người mới 75/100
opensro-dev/opensro#1 · 1 bình luận ·
Maintainer thường phản hồi trong vòng 1 ngày
-
area: server bug priority: medium
Độ khó 3/5 Nửa ngày Mức phù hợp với người mới 55/100
opensro-dev/opensro#3687 ·
Maintainer thường phản hồi trong vòng 1 ngày
-
area: ops bug priority: high
Độ khó 4/5 3-5 ngày Mức phù hợp với người mới 32/100
opensro-dev/opensro#3685 ·
Maintainer thường phản hồi trong vòng 1 ngày
Tất cả issue của opensro-dev/opensro
Issue tương tự
-
Độ khó 2/5 1-3 giờ Mức phù hợp với người mới 66/100
unbound-force/gaze#353 ·
Maintainer thường phản hồi trong vòng 1 ngày
-
bug cross-seed ready-for-human
Độ khó 2/5 1-3 giờ Mức phù hợp với người mới 70/100
Maintainer thường phản hồi trong vòng 1 ngày
-
Độ khó 2/5 1-3 giờ Mức phù hợp với người mới 64/100
OneBusAway/maglev#2102 ·
Maintainer thường phản hồi trong vòng 2 ngày
-
affects-8.5 component/session severity/moderate sig/transaction type/bug
Độ khó 2/5 1-3 giờ Mức phù hợp với người mới 72/100
Maintainer thường phản hồi trong vòng 1 ngày
-
Waiting start: the fixed 503 body says another instance holds the lease when that may not be soĐang mở
Độ khó 1/5 Dưới một giờ Mức phù hợp với người mới 70/100
Judgment-Pack/judgment-pack-gateway#474 ·
Maintainer thường phản hồi trong vòng 1 ngày