[pyplot] Eliminate QuadMesh seams in pcolormesh/hist2d output
Maintainers usually reply within 1 day
Assessment
- Difficulty
- 4/5
- Estimated time
- 3-5 days
- Newbie friendliness
- 25/100
- Issue type
- Bug
- Clarity
- Clearly specified
- Activity status
- Stale
- Tech stack
- python
- Domain
- data-visualization
Research direction
Start with the implementation and regression gates in PR #413, then review the QuadMesh rendering path described in this issue. Check the 11 affected pcolormesh and hist2d gallery examples and their filled-vector visual gate. Done means no unintended shared-edge strokes, intentional edges still work, and all listed Matplotlib structure and gallery acceptance checks pass.
Written by the indexing model from the issue text.
Description
Problem
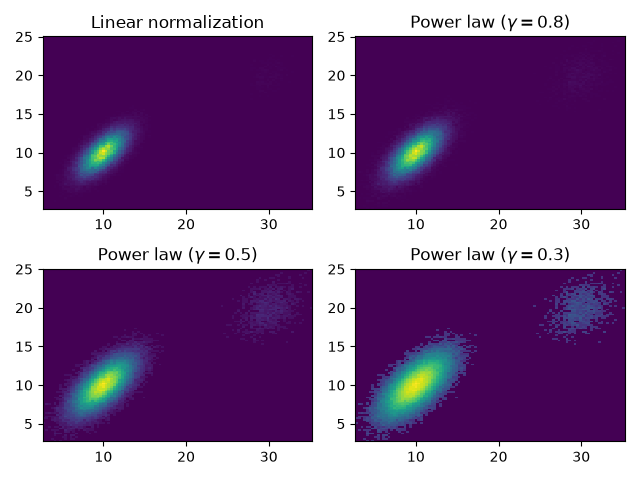
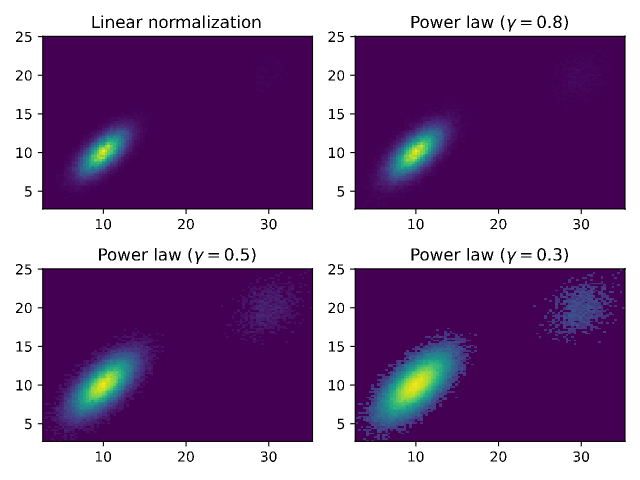
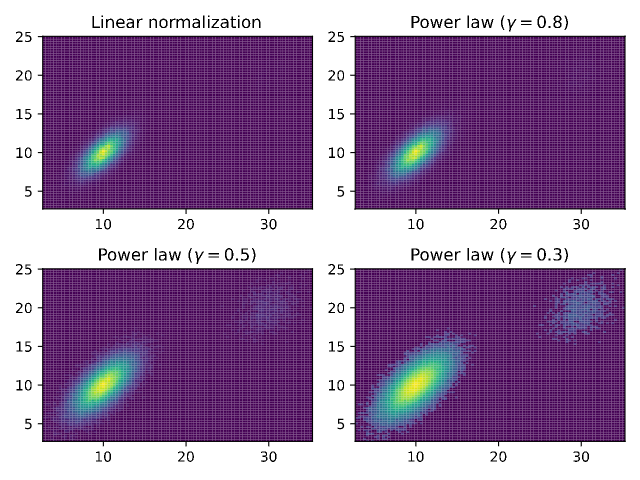
The XY rasterizer used to stroke the shared edges of adjacent mesh cells. That produced visible grid seams in filled pcolormesh and hist2d output even when Matplotlib renders a continuous field.
This root cause directly affects 11 gallery examples using pcolormesh or hist2d, and can affect any downstream QuadMesh rendering.
Comparison
| Matplotlib | Corrected xy.pyplot |
|---|---|
 |
 |
| Before | Difference |
|---|---|
 |
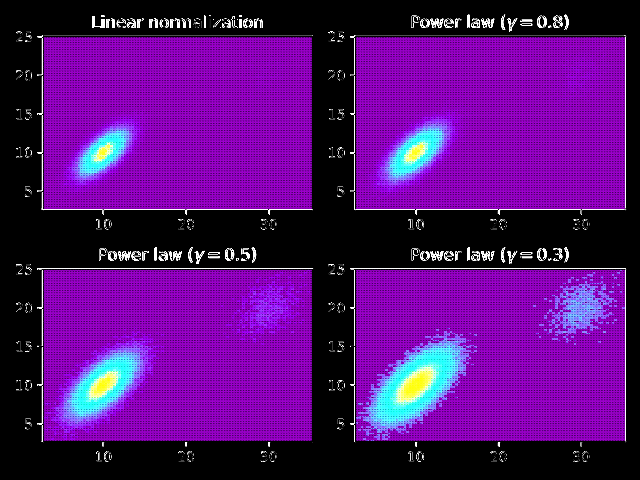 |
The implementation and regression gates are in PR #413.
Complete upstream Matplotlib example
Source: scales/power_norm.py from the supplied Matplotlib 3.11.1 gallery archive.
"""
========================
Exploring normalizations
========================

Various normalization on a multivariate normal distribution.

"""

import matplotlib.pyplot as plt
import numpy as np
from numpy.random import multivariate_normal

import matplotlib.colors as mcolors

# Fixing random state for reproducibility.
np.random.seed(19680801)

data = np.vstack([
    multivariate_normal([10, 10], [[3, 2], [2, 3]], size=100000),
    multivariate_normal([30, 20], [[3, 1], [1, 3]], size=1000)
])

gammas = [0.8, 0.5, 0.3]

fig, axs = plt.subplots(nrows=2, ncols=2)

axs[0, 0].set_title('Linear normalization')
axs[0, 0].hist2d(data[:, 0], data[:, 1], bins=100)

for ax, gamma in zip(axs.flat[1:], gammas):
    ax.set_title(r'Power law $(\gamma=%1.1f)$' % gamma)
    ax.hist2d(data[:, 0], data[:, 1], bins=100, norm=mcolors.PowerNorm(gamma))

fig.tight_layout()

plt.show()

# %%
#
# .. admonition:: References
#
#    The use of the following functions, methods, classes and modules is shown
#    in this example:
#
#    - `matplotlib.colors`
#    - `matplotlib.colors.PowerNorm`
#    - `matplotlib.axes.Axes.hist2d`
#    - `matplotlib.pyplot.hist2d`
Acceptance
- Adjacent mesh cells are filled without unintended boundary strokes.
- Intentional user-specified edges remain supported.
- Mesh geometry, normalization, colorbar, labels, and limits match the Matplotlib structure.
- The filled-vector visual gate passes without a waiver or Matplotlib-renderer fallback.
- All 11 directly affected gallery examples remain ratcheted green.
- Dominant language
- Python
- Stars
- 1.9k
- Forks
- 76
- Avg merge
- 1h 25m
- Merged PRs (30d)
- 5
Getting set up
- No Dockerfile or Docker Compose file
- No pull request template
- Read the contributing guide
First steps
- Read the whole issue, then the project's contributing guide.
- Comment on the issue to say you are picking it up — it saves two people doing the same work.
- Fork the repository and make your change on a branch.
- Open a pull request that references the issue number.
More from reflex-dev/xy
-
Skip finite/log visibility scans when zone maps already prove all-finite on linear axesMay be free again A pull request for this issue was closed without being merged. Openneeds investigate performance
Difficulty 2/5 1-3 hours Newbie friendliness 76/100
reflex-dev/xy#169 ·
Maintainers usually reply within 1 day
-
Difficulty 4/5 3-5 days Newbie friendliness 48/100
reflex-dev/xy#523 ·
Maintainers usually reply within 1 day
-
Difficulty 5/5 Over a week Newbie friendliness 35/100
reflex-dev/xy#516 · 1 comment ·
Maintainers usually reply within 1 day
-
Difficulty 3/5 1-2 days Newbie friendliness 74/100
reflex-dev/xy#512 ·
Maintainers usually reply within 1 day
-
Difficulty 3/5 1-2 days Newbie friendliness 68/100
reflex-dev/xy#511 ·
Maintainers usually reply within 1 day
Similar issues
-
Difficulty 2/5 1-3 hours Newbie friendliness 72/100
-
EvaluationSuite.run fails with default args_for_task and mutates supplied kwargsPossibly taken @ktz03 claimed this today. Open
Difficulty 2/5 1-3 hours Newbie friendliness 82/100
huggingface/evaluate#825 ·
Maintainers usually reply within 1 day
-
dependencies feature github_actions good first issue
Difficulty 2/5 1-3 hours Newbie friendliness 62/100
wemake-services/wemake-django-template#3149 ·
Maintainers usually reply within 1 day
-
[request] vsg/1.1.16Openupstream update
Difficulty 2/5 1-3 hours Newbie friendliness 65/100
conan-io/conan-center-index#31142 ·
Maintainers usually reply within 1 day
-
area:core bug
Difficulty 2/5 1-3 hours Newbie friendliness 78/100
Maintainers usually reply within 1 day