pyplot: open FancyArrowPatch bracket arrows render as filled polygons
Maintainers usually reply within 1 day
Assessment
- Difficulty
- 4/5
- Estimated time
- 3-5 days
- Newbie friendliness
- 55/100
- Issue type
- Bug
- Clarity
- Mostly clear
- Activity status
- Quiet
- Tech stack
- matplotlib, python
- Domain
- data-visualization
Research direction
Start by running text_labels_and_annotations/angles_on_bracket_arrows.py with the import changed to xy.pyplot, then compare its output with Matplotlib 3.11.0 and the supplied pixel evidence. Trace the FancyArrowPatch and ArrowStyle entry points used by the open ]-[ brackets and curved annotation arrows. Done means both render as open strokes without large filled polygons and match the reference geometry.
Written by the indexing model from the issue text.
Description
Summary
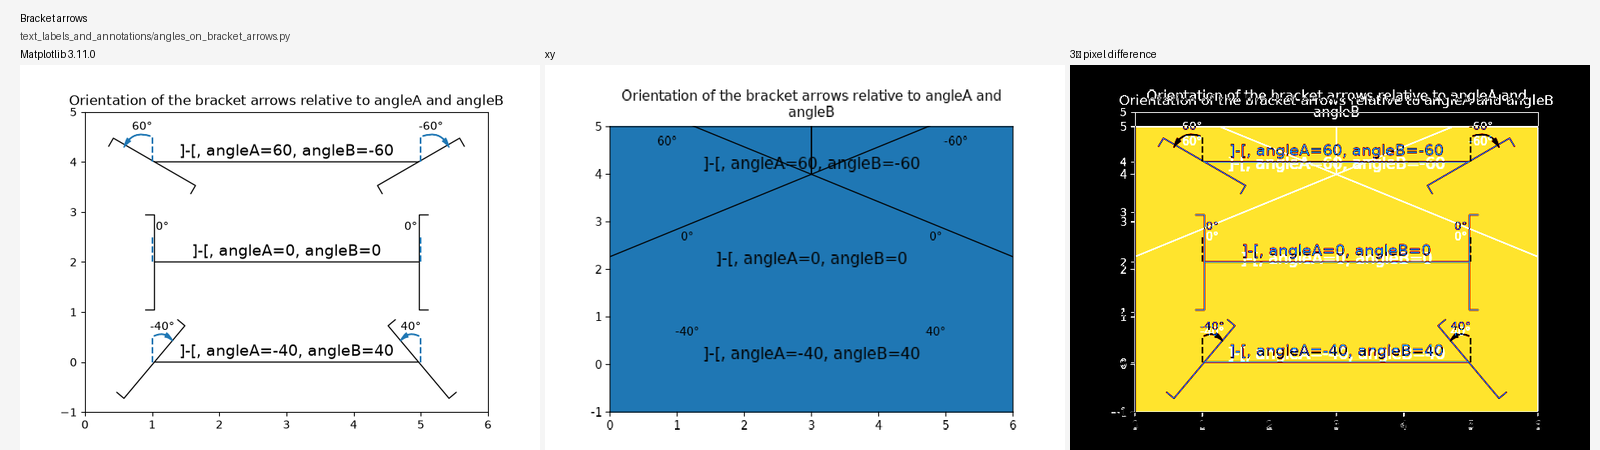
The official Matplotlib text_labels_and_annotations/angles_on_bracket_arrows.py gallery example completes under xy.pyplot, but open FancyArrowPatch bracket arrows are filled as large solid polygons. The fills cover most of the axes and turn curved connectors into diagonal polygon edges.
Environment
xy:d505ef5789d8b18e23fd838300b039932dc399ce- Matplotlib reference:
3.11.0 - Python:
3.14.5 - source:
text_labels_and_annotations/angles_on_bracket_arrows.pyfrom the supplied Matplotlib stablegallery_python.zip
Full Matplotlib example
Verbatim source from the supplied archive:
"""
===================================
Angle annotations on bracket arrows
===================================

This example shows how to add angle annotations to bracket arrow styles
created using `.FancyArrowPatch`. *angleA* and *angleB* are measured from a
vertical line as positive (to the left) or negative (to the right). Blue
`.FancyArrowPatch` arrows indicate the directions of *angleA* and *angleB*
from the vertical and axes text annotate the angle sizes.
"""

import matplotlib.pyplot as plt
import numpy as np

from matplotlib.patches import FancyArrowPatch


def get_point_of_rotated_vertical(origin, line_length, degrees):
    """Return xy coordinates of the vertical line end rotated by degrees."""
    rad = np.deg2rad(-degrees)
    return [origin[0] + line_length * np.sin(rad),
            origin[1] + line_length * np.cos(rad)]


fig, ax = plt.subplots()
ax.set(xlim=(0, 6), ylim=(-1, 5))
ax.set_title("Orientation of the bracket arrows relative to angleA and angleB")

style = ']-['
for i, angle in enumerate([-40, 0, 60]):
    y = 2*i
    arrow_centers = ((1, y), (5, y))
    vlines = ((1, y + 0.5), (5, y + 0.5))
    anglesAB = (angle, -angle)
    bracketstyle = f"{style}, angleA={anglesAB[0]}, angleB={anglesAB[1]}"
    bracket = FancyArrowPatch(*arrow_centers, arrowstyle=bracketstyle,
                              mutation_scale=42)
    ax.add_patch(bracket)
    ax.text(3, y + 0.05, bracketstyle, ha="center", va="bottom", fontsize=14)
    ax.vlines([line[0] for line in vlines], [y, y], [line[1] for line in vlines],
              linestyles="--", color="C0")
    # Get the top coordinates for the drawn patches at A and B
    patch_tops = [get_point_of_rotated_vertical(center, 0.5, angle)
                  for center, angle in zip(arrow_centers, anglesAB)]
    # Define the connection directions for the annotation arrows
    connection_dirs = (1, -1) if angle > 0 else (-1, 1)
    # Add arrows and annotation text
    arrowstyle = "Simple, tail_width=0.5, head_width=4, head_length=8"
    for vline, dir, patch_top, angle in zip(vlines, connection_dirs,
                                            patch_tops, anglesAB):
        kw = dict(connectionstyle=f"arc3,rad={dir * 0.5}",
                  arrowstyle=arrowstyle, color="C0")
        ax.add_patch(FancyArrowPatch(vline, patch_top, **kw))
        ax.text(vline[0] - dir * 0.15, y + 0.7, f'{angle}°', ha="center",
                va="center")

plt.show()

# %%
#
# .. admonition:: References
#
#    The use of the following functions, methods, classes and modules is shown
#    in this example:
#
#    - `matplotlib.patches.ArrowStyle`
Reproduction with xy
Run the complete source above after changing only:
import matplotlib.pyplot as plt
to:
import xy.pyplot as plt
Expected
The open bracket strokes and curved annotation arrows render without a filled interior, matching the Matplotlib geometry.
Actual
Large blue filled polygons cover roughly 60% of the canvas. In the pixel audit, 60.40% of pixels differ from the Matplotlib reference (mean absolute channel error 64.02); both outputs are 640×480.
Screenshot
Matplotlib 3.11.0 / xy / 3×-contrast pixel difference:
Full evidence provenance: https://github.com/reflex-dev/xy/blob/32993475aa208a5b321bd15081848340f7e61bf3/review-evidence/pyplot-gallery-audit-2026-07-30/README.md
- Dominant language
- Python
- Stars
- 1.9k
- Forks
- 76
- Avg merge
- 1h 25m
- Merged PRs (30d)
- 5
Getting set up
- No Dockerfile or Docker Compose file
- No pull request template
- Read the contributing guide
First steps
- Read the whole issue, then the project's contributing guide.
- Comment on the issue to say you are picking it up — it saves two people doing the same work.
- Fork the repository and make your change on a branch.
- Open a pull request that references the issue number.
More from reflex-dev/xy
-
Skip finite/log visibility scans when zone maps already prove all-finite on linear axesMay be free again A pull request for this issue was closed without being merged. Openneeds investigate performance
Difficulty 2/5 1-3 hours Newbie friendliness 76/100
reflex-dev/xy#169 ·
Maintainers usually reply within 1 day
-
Difficulty 4/5 3-5 days Newbie friendliness 48/100
reflex-dev/xy#523 ·
Maintainers usually reply within 1 day
-
Difficulty 5/5 Over a week Newbie friendliness 35/100
reflex-dev/xy#516 · 1 comment ·
Maintainers usually reply within 1 day
-
Difficulty 3/5 1-2 days Newbie friendliness 74/100
reflex-dev/xy#512 ·
Maintainers usually reply within 1 day
-
Difficulty 3/5 1-2 days Newbie friendliness 68/100
reflex-dev/xy#511 ·
Maintainers usually reply within 1 day
Similar issues
-
Difficulty 2/5 1-3 hours Newbie friendliness 72/100
-
EvaluationSuite.run fails with default args_for_task and mutates supplied kwargsPossibly taken @ktz03 claimed this today. Open
Difficulty 2/5 1-3 hours Newbie friendliness 82/100
huggingface/evaluate#825 ·
Maintainers usually reply within 1 day
-
dependencies feature github_actions good first issue
Difficulty 2/5 1-3 hours Newbie friendliness 62/100
wemake-services/wemake-django-template#3149 ·
Maintainers usually reply within 1 day
-
[request] vsg/1.1.16Openupstream update
Difficulty 2/5 1-3 hours Newbie friendliness 65/100
conan-io/conan-center-index#31142 ·
Maintainers usually reply within 1 day
-
area:core bug
Difficulty 2/5 1-3 hours Newbie friendliness 78/100
Maintainers usually reply within 1 day