Why is matplotlib basemap not plotting the colours of some areas in my map?
Nessuno ha ancora preso questa issue.
Valutazione
- Difficoltà
- 4/5
- Tempo stimato
- 3-5 giorni
- Idoneità per principianti
- 28/100
- Tipo di issue
- Bug
- Chiarezza
- Abbastanza chiara
- Stato di attività
- Ferma
- Stack tecnologico
- python
- Ambito
- data-visualization
Direzione di ricerca
Inizia con la chiamata map.readshapefile ed esamina le voci risultanti map.states e map.states_info per le regioni interessate. Riproduci gli esempi del Vietnam e delle Philippines, quindi confronta le geometrie dello shapefile con le patch Polygon aggiunte agli axes. Il lavoro è completato quando hai identificato perché le regioni interessate non vengono riempite visibilmente e hai documentato una correzione riproducibile o una spiegazione chiara da upstream.
Scritto dal modello di indicizzazione a partire dal testo della issue.
Descrizione
The code below is supposed to colour all the states of Vietnam:
import pandas as pd
import matplotlib.pyplot as plt
from mpl_toolkits.basemap import Basemap

fig, ax = plt.subplots(figsize=(10,20))

# create the map
map = Basemap(resolution='l', # c, l, i, h, f or None
            projection='merc',
            lat_0=15.95, lon_0=105.85,
            llcrnrlon=102., llcrnrlat= 8.31, urcrnrlon=109.69, urcrnrlat=23.61)


# load the shapefile, use the name 'states'
map.readshapefile(r'path\to\gadm36_VNM_1', name='states', drawbounds=True)
# shapefile downloaded from http://www.gadm.org/


# collect the state names from the shapefile attributes so we can
# look up the shape obect for a state by it's name
state_names = []
for shape_dict in map.states_info:
    state_names.append(shape_dict['VARNAME_1'])

ax = plt.gca() # get current axes instance


# NOR, CEN, SOU and MEK are some subdivisions I have created for the states of Vietnam

NOR = ['Lai Chau',
'Lao Cai',
'Ha Giang',
'Cao Bang',
'Dien Bien',
'Son La',
'Yen Bai',
'Tuyen Quang',
'Bac Kan',
'Lang Son',
'Thai Nguyen',
'Phu Tho',
'Vinh Phuc',
'Hoa Binh',
'Ha Noi',
'Bac Ninh',
'Hai Duong',
'Hung Yen',
'Ha Nam',
'Quang Ninh',
'Hai Phong',
'Thai Binh',
'Nam Dinh',
'Bac Giang',
'Ninh Binh']


CEN = ['Thanh Hoa',
      'Nghe An',
      'Ha Tinh',
      'Quang Binh',
      'Quang Tri',
      'Thua Thien Hue',
      'Da Nang']


SOU = ['Quang Nam',
      'Kon Tum',
      'Quang Ngai',
      'Gia Lai',
      'Binh Dinh',
      'Dak Lak',
      'Phu Yen',
      'Khanh Hoa',
      'Dak Nong',
      'Lam Dong',
      'Ninh Thuan']


MEK = ['Binh Phuoc',
      'Dong Nai',
      'Binh Thuan',
      'Tay Ninh',
      'Binh Duong',
      'Dong Nai',
      'Ba Ria - Vung Tau',
      'Ho Chi Minh',
      'Long An',
      'An Giang',
      'Dong Thap',
      'Tien Giang',
      'Kien Giang',
      'Can Tho',
      'Vinh Long',
      'Ben Tre',
      'Hau Giang',
      'Tra Vinh',
      'Soc Trang',
      'Bac Lieu',
      'Ca Mau']


# Define the colours to be used to colour the states

from matplotlib import cm
from numpy import linspace

start = 0.5
stop = 1.0
number_of_lines= 4
cm_subsection = linspace(start, stop, number_of_lines)

cm_subsection[0] = cm_subsection[0]*4
cm_subsection[1] = cm_subsection[1]*0.6
cm_subsection[2] = cm_subsection[2]*0.8
cm_subsection[3] = cm_subsection[3]*0.1

colors = [ cm.Blues(x) for x in cm_subsection ]


for state in NOR:
    seg = map.states[state_names.index(state)]
    poly = Polygon(seg, facecolor=colors[0], edgecolor=colors[0])
    ax.add_patch(poly)

for state in CEN:
    seg = map.states[state_names.index(state)]
    poly = Polygon(seg, facecolor=colors[1], edgecolor=colors[1])
    ax.add_patch(poly)

for state in SOU:
    seg = map.states[state_names.index(state)]
    poly = Polygon(seg, facecolor=colors[2], edgecolor=colors[2])
    ax.add_patch(poly)

for state in MEK:
    seg = map.states[state_names.index(state)]
    poly = Polygon(seg, facecolor=colors[3], edgecolor=colors[3])
    ax.add_patch(poly)


import matplotlib.patches as mpatches

NOR_patch = mpatches.Patch(color=colors[0], label='Rate: 34.85%')
CEN_patch = mpatches.Patch(color=colors[1], label='Rate: 25.61%')
SOU_patch = mpatches.Patch(color=colors[2], label='Rate: 32.66%')
MEK_patch = mpatches.Patch(color=colors[3], label='Rate: 20.02%')
plt.legend(handles=[NOR_patch, CEN_patch, SOU_patch, MEK_patch])
plt.show()
But this produces the map below, where some of the states are not coloured even though they are present in the state names and in the subdivisions:

In fact, if I try to colour a state whose name is not present in the lists, it throws an error:
MEK.append('ABCDE')

---------------------------------------------------------------------------
ValueError                                Traceback (most recent call last)
<ipython-input-619-a89da62a0831> in <module>()
    134
    135 for state in MEK:
--> 136     seg = map.states[state_names.index(state)]
    137     poly = Polygon(seg, facecolor=colors[3], edgecolor=colors[3])
    138     ax.add_patch(poly)

ValueError: 'ABCDE' is not in list
So, clearly the states that are not colored are present in the list, as I'm not getting any error. So, what's going on?
EDIT: It just struck me that almost all the states that aren’t coloured share at least some part of their border with sea/ocean in the real world. The 6 exceptions are highlighted in red below:

Now that’s very interesting! Could it have anything to do with the issue? If yes, what? And why? And why do those 6 exceptions exist?
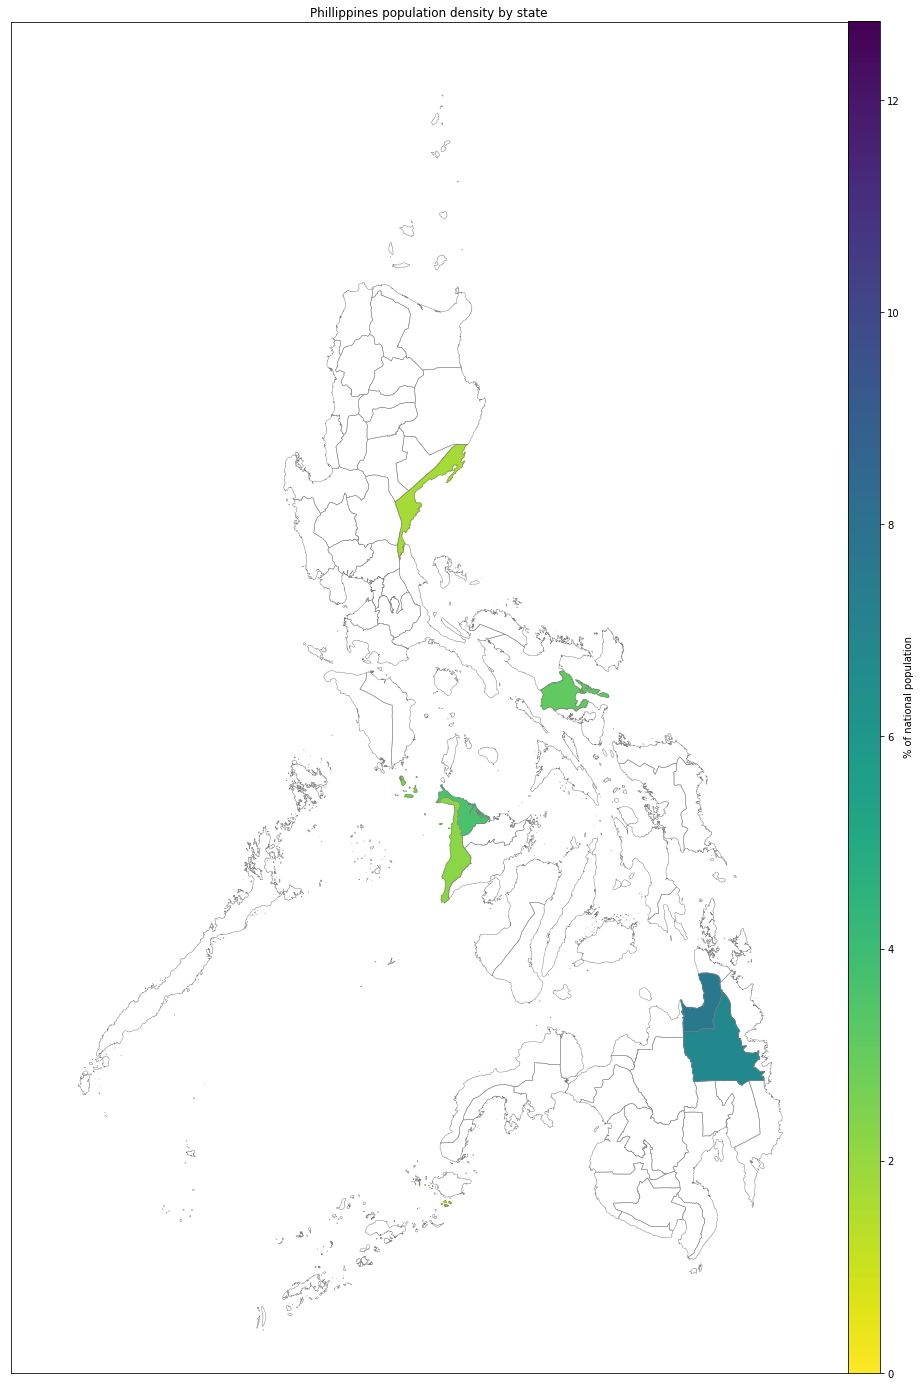
EDIT 2: I have also found similar results when plotting the map of Philippines:
- Lingua principale
- Python
- Stelle
- 817
- Fork
- 395
- Metriche di merge delle PR
- Nessuna PR unita negli ultimi 30g
Guida per i contributori
Nessuna guida per i contributori indicizzata per questo repository
Come iniziare
- Leggi tutta la issue e poi la guida ai contributi del progetto.
- Commenta sulla issue per dire che te ne occupi tu — evita che due persone facciano lo stesso lavoro.
- Fai un fork del repository e lavora su un branch.
- Apri una pull request che faccia riferimento al numero della issue.
Altre issue di matplotlib/basemap
-
small bug in drawmapscale Aperta
Difficoltà 2/5 1-3 ore Idoneità per principianti 68/100
matplotlib/basemap#368 ·
-
Python 3.14 wheels Aperta
Difficoltà 4/5 3-5 giorni Idoneità per principianti 48/100
matplotlib/basemap#652 · 2 commenti · 5 reazioni ·
-
Difficoltà 2/5 1-3 ore Idoneità per principianti 45/100
matplotlib/basemap#649 · 2 reazioni ·
-
Difficoltà 5/5 Più di una settimana Idoneità per principianti 35/100
matplotlib/basemap#646 ·
-
Difficoltà 2/5 1-3 ore Idoneità per principianti 48/100
matplotlib/basemap#645 · 2 commenti ·
Tutte le issue di matplotlib/basemap
Issue simili
-
essnmx good first issue
Difficoltà 1/5 Meno di un'ora Idoneità per principianti 95/100
-
[Feature] 奇物选择添加优先级 Aperta
Difficoltà 2/5 1-3 ore Idoneità per principianti 65/100
syfoud/Simulated_Scepter#174 ·
-
Difficoltà 2/5 1-3 ore Idoneità per principianti 75/100
Giskard-AI/giskard-oss#2840 · 1 commento ·
-
A claim comment carrying the issue number is silently declined while the workflow reports success Apertaarea: repo bug perceived difficulty: 2
Difficoltà 2/5 1-3 ore Idoneità per principianti 70/100
-
Difficoltà 2/5 1-3 ore Idoneità per principianti 75/100
yeti-platform/yeti#1380 ·