echarts如何绘制泰勒曲线?
Nobody has claimed this yet.
Assessment
- Difficulty
- 5/5
- Estimated time
- Over a week
- Newbie friendliness
- 20/100
- Issue type
- Feature
- Clarity
- Needs clarification
- Activity status
- Stale
- Tech stack
- typescript
- Domain
- data-visualization
Research direction
No file, test, or entry point is named. First clarify how the Taylor curve should be represented in ECharts, including custom X/Y-axis values and value-based spacing; done should be demonstrated by a working example matching the requested chart.
Written by the indexing model from the issue text.
Description
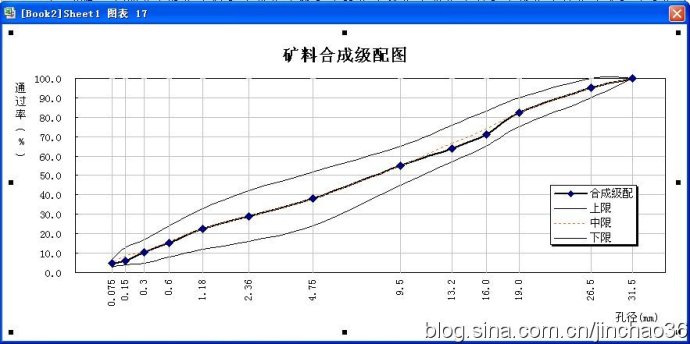
类似于这样,能自定义XV轴显示的值,同时根据值保持间距。
- Dominant language
- TypeScript
- Stars
- 400
- Forks
- 250
- Avg merge
- 3d 7h
- Merged PRs (30d)
- 6
Getting set up
This project ships no dev container, Dockerfile or contributing guide, so setting up is up to you: start from its README, and see our first-contribution guide for the general steps.
First steps
- Read the whole issue, then the project's contributing guide.
- Comment on the issue to say you are picking it up — it saves two people doing the same work.
- Fork the repository and make your change on a branch.
- Open a pull request that references the issue number.
More from apache/echarts-examples
-
Difficulty 3/5 1-2 days Newbie friendliness 35/100
apache/echarts-examples#142 ·
-
Difficulty 2/5 1-3 hours Newbie friendliness 55/100
apache/echarts-examples#139 ·
-
Difficulty 2/5 1-3 hours Newbie friendliness 55/100
apache/echarts-examples#135 · 1 comment ·
-
Difficulty 2/5 1-3 hours Newbie friendliness 45/100
apache/echarts-examples#132 · 1 comment ·
-
Difficulty 5/5 Over a week Newbie friendliness 15/100
apache/echarts-examples#98 · 1 comment ·
All issues in apache/echarts-examples
Similar issues
-
Difficulty 1/5 Under an hour Newbie friendliness 72/100
betagouv/mon-entreprise#4699 ·
Maintainers usually reply within 3 days
-
bug
Difficulty 2/5 1-3 hours Newbie friendliness 82/100
jaegertracing/jaeger-ui#4547 · 3 comments ·
Maintainers usually reply within 1 day
-
ai-driven-qa
Difficulty 2/5 1-3 hours Newbie friendliness 84/100
linagora/twake-calendar-frontend#1467 ·
Maintainers usually reply within 1 day
-
Difficulty 2/5 1-3 hours Newbie friendliness 78/100
need4deed-org/sdk#267 ·
Maintainers usually reply within 1 day
-
Difficulty 2/5 1-3 hours Newbie friendliness 84/100
auth0/universal-login#414 ·
Maintainers usually reply within 1 day