
Clarify that CPU is between samples and category&stack are at sample time
#3,240 建立於 2021年3月25日
倉庫指標
- 星標
- (1,515 顆星)
- PR 合併指標
- (PR 指標待抓取)
描述
When CPU numbers are shown, the tooltip looks like this:
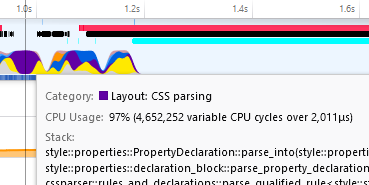 So it's something like this:
Category: [] Layout... CPU Usage: 97% (...) Stack: parse_into()... ...
I'm concerned that we're mixing two "domains" of information, and it may give the wrong impression, e.g.: "Wow, this parse_into in layout is taking 97% of a CPU!". But in fact, all we can say from this data is: Since the previous sample and now, we have used 97% of a CPU; And at this exact sample time we were calling parse_into in layout.
So I think we should clarify the difference. Suggestion:
CPU Usage since previous sample: 97% (...) ..................................................................................... Sample at time: 0.8465s Category: [] Layout... Stack: parse_into()... ...
This clearly separates the more continuous CPU numbers from the point-like sample data.
As a bonus it shows the precise timestamp. I don't know how valuable that is, but for example it could help find markers at that time in the Marker Table.
┆Issue is synchronized with this Jira Task