
help wantedpolishprofile data
倉庫指標
- 星標
- (1,515 顆星)
- PR 合併指標
- (PR 指標待抓取)
描述
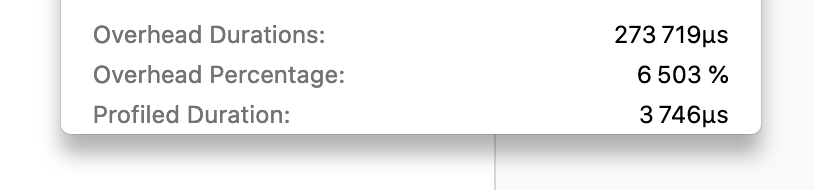
In the metadata panel, at the bottom of the "Profiler Overhead" section, I see "Profiled Duration" displayed with a micro second unit, but I suspect the value is in ms. The "Overhead Percentage" shown is above 6000%, which doesn't make sense, it's likely 6%.
Example profile: https://share.firefox.dev/39HHwhu
┆Issue is synchronized with this Jira Task