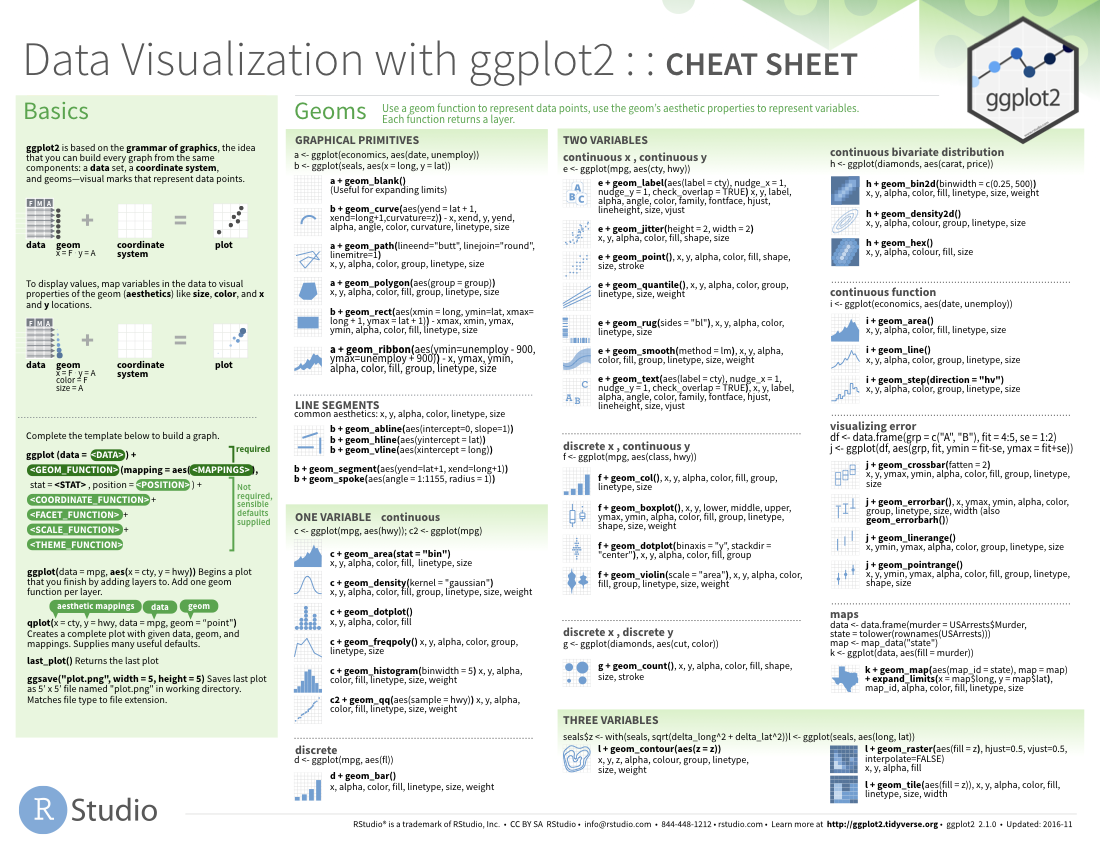
Probably best to make it in svg (e.g. with Inkscape).

Contributor guide
Tech stack
None
Domain
documentation
Issue type
documentation
DifficultyEstimated implementation difficulty for a new contributor, from 1 for very small changes to 5 for expert-level work.
2
Estimated timeA rough time range for an experienced contributor to investigate, implement, test, and prepare a pull request.
half day
Activity statusHow available the issue appears right now: fresh, active, stale, blocked, or waiting on maintainer input.
stale
ClarityHow clearly the issue explains the expected change, acceptance criteria, and next step.
clear
Prerequisites
Basic R and tmap knowledgeSVG or Inkscape experience
Newbie friendlinessA 1-100 score estimating how approachable this issue is for first-time contributors.
70
Research direction
Review the example image linked in the issue (a data visualization cheat sheet) for layout inspiration. Explore the tmap package documentation and existing vignettes to ensure the cheat sheet covers key functions. Use Inkscape to create an SVG with graphical elements and text. Consider submitting a draft for feedback in the issue comments.