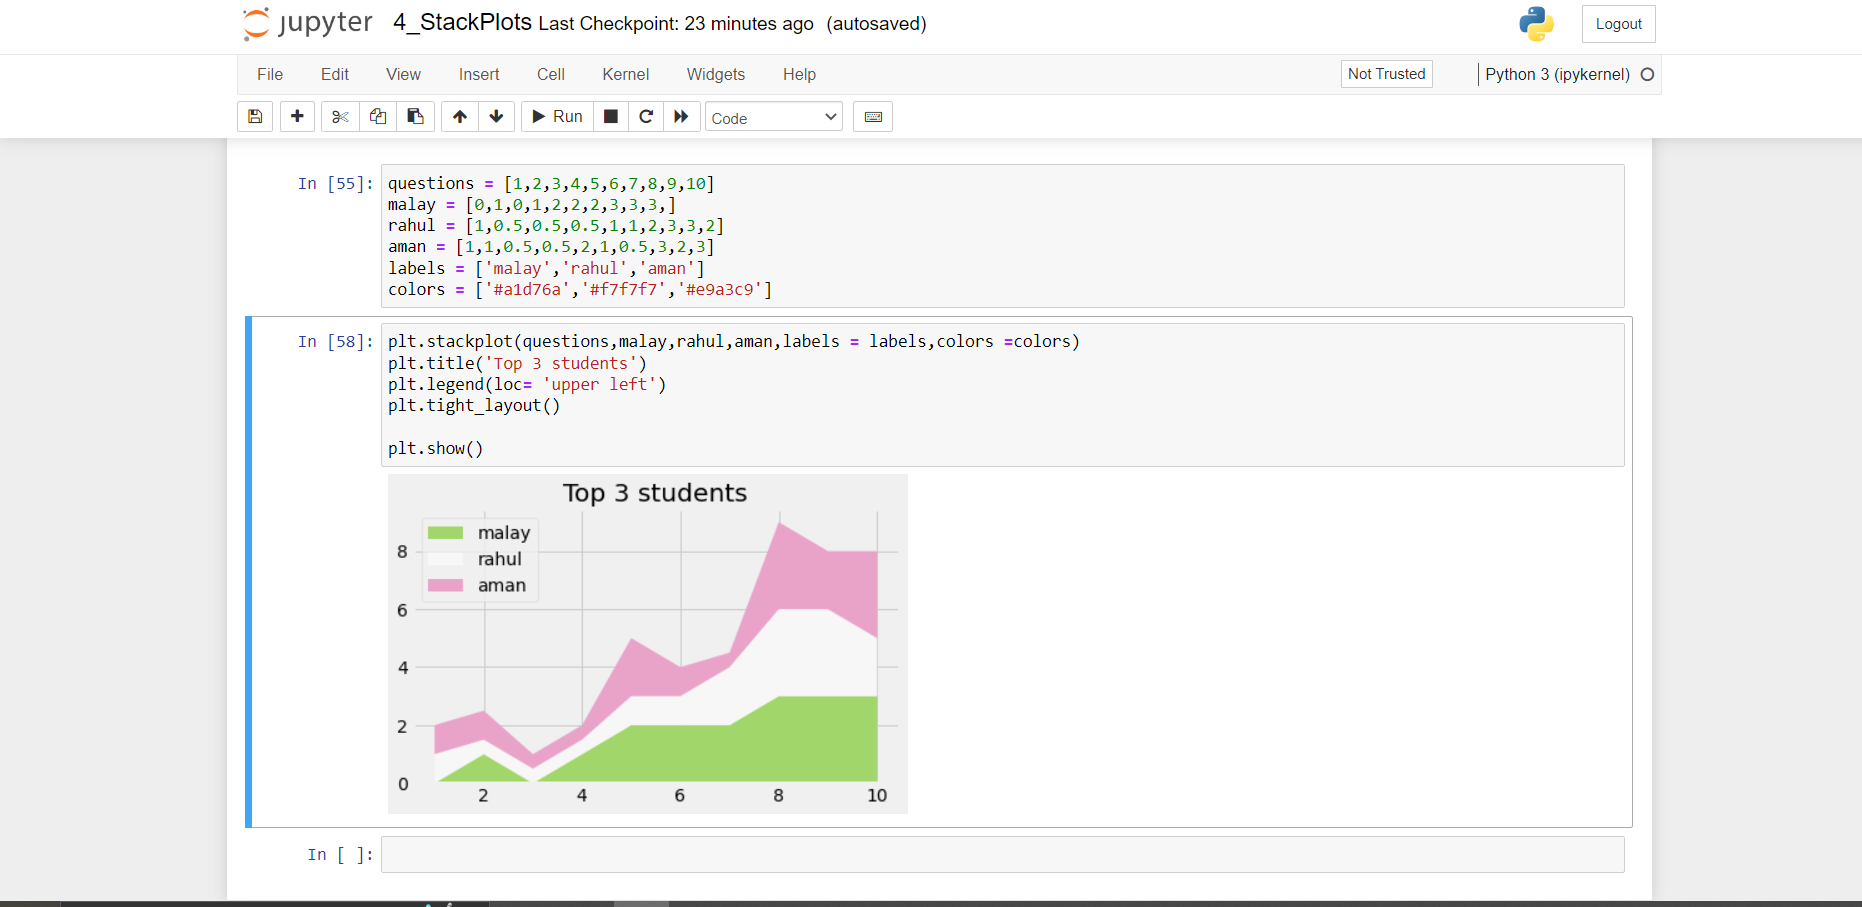
HEY CODERS! I wanna fix my x-axis where difference between locations is 2, I want it to be 1 i.e. similar to 0,1,2,3 ..10.
Nobody has claimed this yet.
Assessment
- Difficulty
- 3/5
- Estimated time
- 1-2 days
- Newbie friendliness
- 25/100
- Issue type
- Bug
- Clarity
- Needs clarification
- Activity status
- Stale
- Tech stack
- matplotlib
- Domain
- data-visualization
Research direction
The issue provides only a screenshot and does not name a notebook, file, or test. First locate the notebook or example that produced the chart and reproduce the x-axis behavior; done means the axis shows consecutive locations such as 0, 1, 2, through 10 with spacing of 1.
Written by the indexing model from the issue text.
Description
- Dominant language
- Jupyter Notebook
- Stars
- 0
- Forks
- 0
- PR merge metrics
- No merged PRs in 30d
Contributor guide
No contributing guide indexed for this repository
First steps
- Read the whole issue, then the project's contributing guide.
- Comment on the issue to say you are picking it up — it saves two people doing the same work.
- Fork the repository and make your change on a branch.
- Open a pull request that references the issue number.
More from malaythakur/Matplotlib
-
question
Difficulty 3/5 1-2 days Newbie friendliness 20/100
All issues in malaythakur/Matplotlib
Similar issues
-
Urgent request: Due to vulnerabilities move to API version 12.6.1 (12.6.2 eventually) or 13.1.1 Open
Difficulty 2/5 1-3 hours Newbie friendliness 65/100
jbkunst/highcharter#849 ·
-
Difficulty 2/5 1-3 hours Newbie friendliness 74/100
bancolombia/sentinel#23 ·
-
bug
Difficulty 2/5 1-3 hours Newbie friendliness 78/100
AOSSIE-Org/OrgExplorer#245 · 1 assignee ·
-
tech-debt
Difficulty 2/5 1-3 hours Newbie friendliness 78/100
-
Difficulty 2/5 1-3 hours Newbie friendliness 72/100
gordonwatts/test-wsl2-llm#151 ·