
[FR] Introduce shadow curves to line smoothness metrics plot
#2,720 opened on 2020年4月16日
Repository metrics
- Stars
- (17,127 stars)
- PR merge metrics
- (平均マージ 2d 9h) (30d で 246 merged PRs)
説明
Thank you for submitting an issue. Please refer to our issue policy for information on what types of issues we address.
Please fill in this template and do not delete it unless you are sure your issue is outside its scope.
Guidelines
Feature requests typically go through the following lifecycle:
- Submit feature request with high-level description on GitHub issues (this is what you're doing now)
- Discuss feature request with a committer, who may ask for a more detailed design
- After discussion & agreement on feature request, start implementation
Describe the proposal
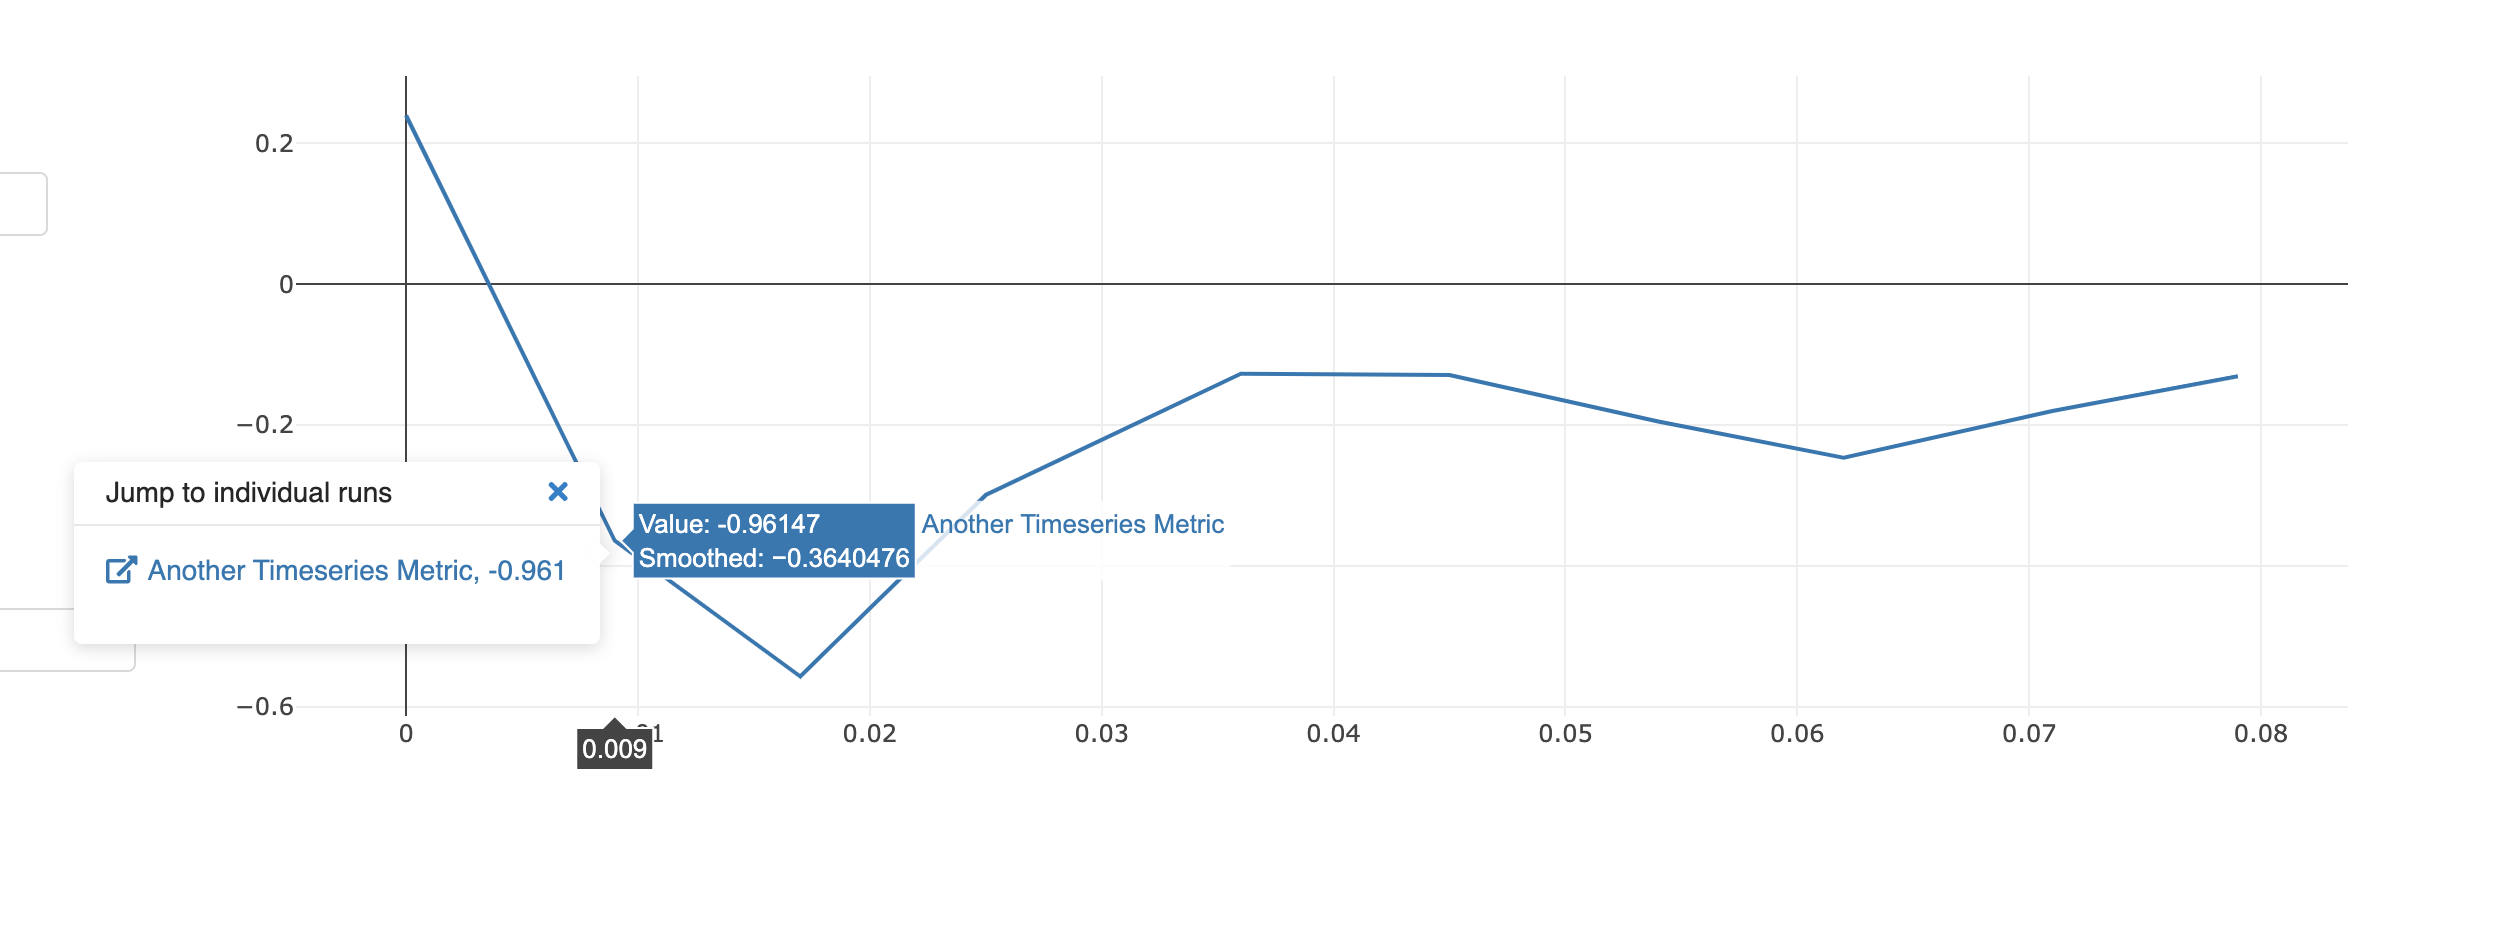
#2620 made improvements to the line smoothness functionality in the metrics plot view; we now display the smoothed value and the original value at each point on a given metrics plot curve. Unfortunately, we do not provide any visual reference for the original value; this makes it somewhat difficult to reason about the original value.
To provide visual guidance for the original value figure displayed in a smoothed metrics plot, I propose displaying a faded "shadow" curve with the original values in addition to the smoothed curve in the metrics plot view.
Motivation
As discussed above, the lack of any visual reference for the original metric value displayed at a point along a given smoothed metric curve makes it difficult to reason about how this value changes as a function of x.
Proposed Changes
We propose to introduce a UI-only change that adds a shadow curve to the metrics plot view as follows:
Before
After