
EnhancementHelp wanted
Repository metrics
- Stars
- (21,513 stars)
- PR merge metrics
- (平均マージ 8d 11h) (30d で 106 merged PRs)
説明
With the generic metric dashboards can be used more and more. By adding rows to the dashboard, you can put for example 4 generic metrics on top of the board and underneath for example in 2 column for different graphs.
For example:
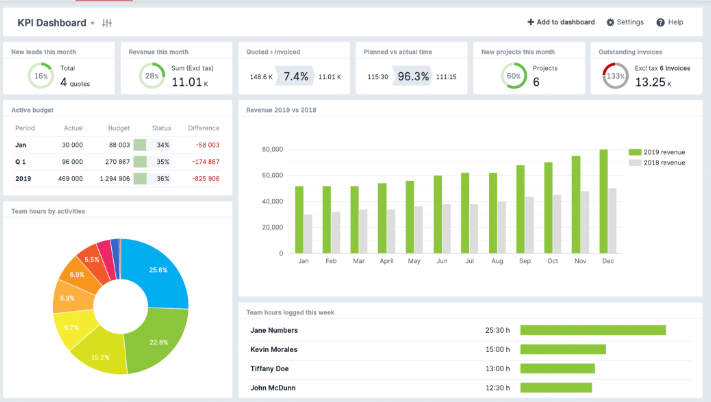
I think a maximum of three rows is enough. Per row then you can select multiple columns or are pre-defined: For example: row1 - 4 columns row2 - 2 columns row3 - 3 columns
or
row1 - 3columns row2 - 4 columns row3 - 2 columns
or.....