
GCES-Pydemic/pydemic-ui
[BUG] Failure to render graphs in projections_br.py
オープン
#26 opened on 2020/10/10
bughelp wanted
Repository metrics
- Stars
- (0 個のスター)
- PR merge metrics
- (30d に merged PR はありません)
説明
Describe the bug When running the file projections_br.py with streamlit, an error occurs saying AttributeError: 'DataFrame' object has no attribute 'get_figure' Perhaps some compatibility error with Pandas plotting feature?
To Reproduce Steps to reproduce the behavior:
- Go to pydemic_ui directory root;
- execute the command:
streamlit run pydemic_ui/apps/app_menu.py - Select option "Brazil Epidemic projections and forecast"

- Scroll down and see the error:
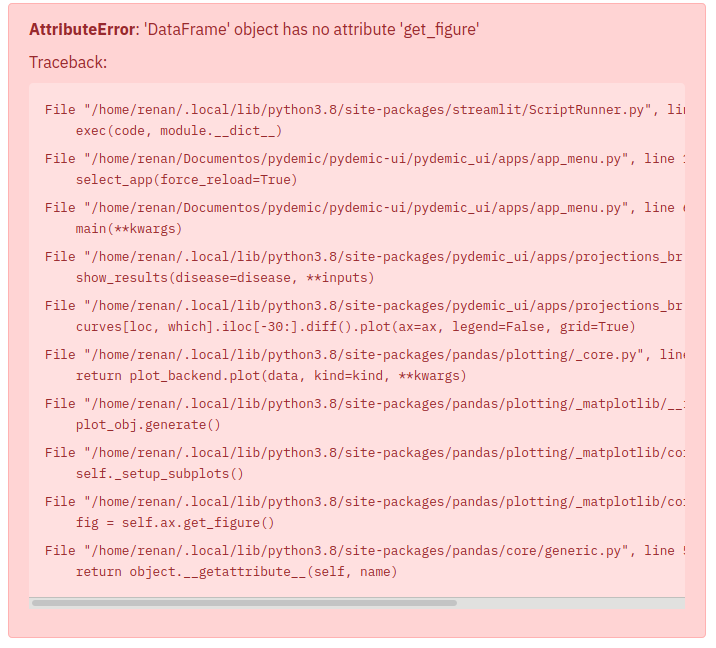
Expected behavior It is expected to show all available graphs and information without errors.
Desktop (please complete the following information):
- OS: Linux Mint 19.3 Tricia
- Browser Mozilla Firefox 75.0 (64-bits)
Additional context
Apparently the problem is caused by these lines of code:
