
ChartsOrg/Charts
Y labels are not shown fully when using setVisibleYRangeMinimum
Offen
#3.315 geöffnet am 03.03.2018
bughelp wanted★★
Repository-Metriken
- Stars
- (28.009 Sterne)
- PR-Merge-Metriken
- (Keine gemergten PRs in 30 T)
Beschreibung
I'm having troubles getting setVisibleYRangeMinimum to work properly. I expect it not only to zoom out to minimum range but also to display all the labels on Y axis.
Here's my code snippet:
data.addDataSet(set1)
wrapperGraphView.data = data
wrapperGraphView.setVisibleYRangeMinimum(300, axis: .left)
wrapperGraphView.notifyDataSetChanged()
Here's the result:
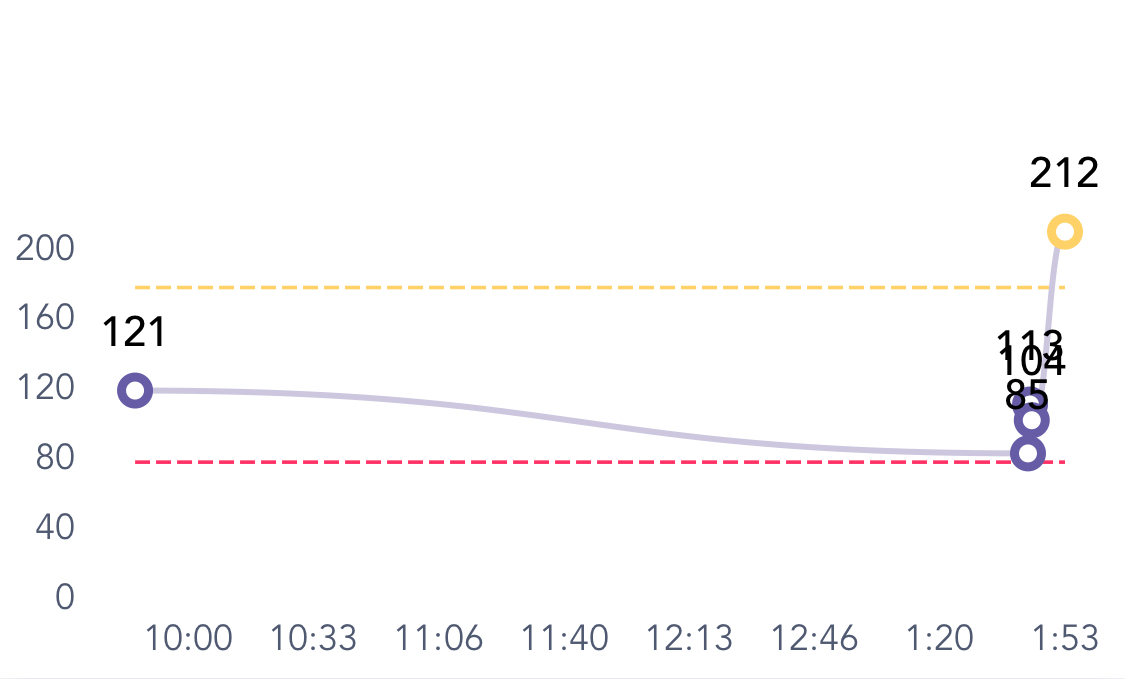
It's zooming out properly, but does not display all the labels up to 300 on Y axis.
It seems to be similar to https://github.com/danielgindi/Charts/issues/199 but none of the suggested solutions worked for me.
Any suggestions would be appreciated.